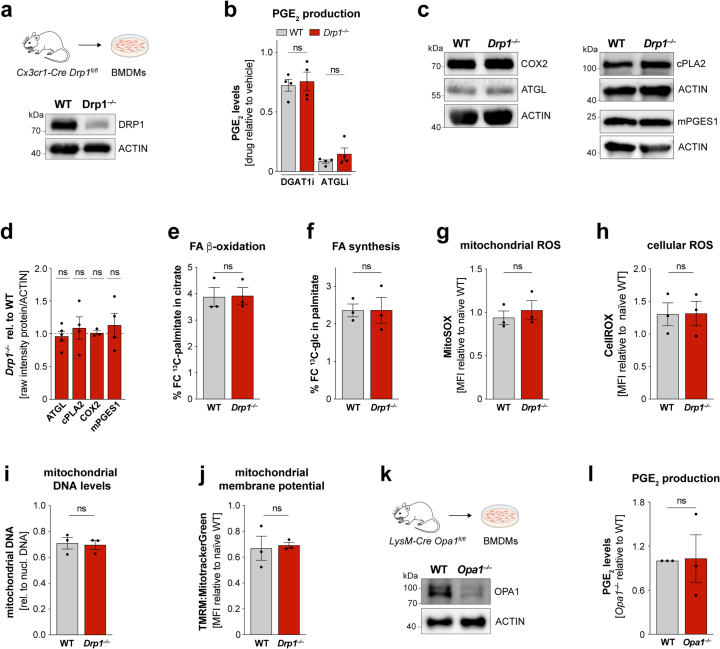
Extended Data Fig. 9. DRP1-regulated PGE2 production is not driven by changes in key mitochondrial functions.
a Western Blot analysis showing the KO efficiency of Drp1−/− macrophages obtained from Cx3cr1-Cre Drp1fl/fl mice representative of n = 3 biological replicates. b PGE2 levels of LPS/IFN-γ-activated (24 h) WT and Drp1−/− BMDMs treated with DGAT1i or ATGLi representing n = 4 biological replicates. P values were generated using one-way ANOVA with Sidak’s post-hoc test. c,d Western Blot images (c) and quantification (d) showing protein levels of enzymes involved in FA release (ATGL, cPLA2) and PGE2 biogenesis (COX2, mPGES1) in LPS/IFN-γ-treated WT and Drp1−/− BMDMs (24 h). Data represent n = 3 (COX2) and n = 4 (cPLA2, mPGES1) and n = 5 (ATGL) biological replicates (c,d). P values were obtained using two-tailed, one-sample t tests (d). e,f Metabolic tracing analysis of LPS/IFN-γ-activated WT and Drp1−/− BMDMs showing 13C-palmitate fueling in citrate (FA oxidation) (e) and 13C-glucose fueling into palmitate (FA synthesis) (f) from n = 3 biologically independent replicates. P values were obtained using two-way, unpaired t tests. g,h Mitochondrial (g) and cellular ROS (h) measurements in LPS/IFN-γ-treated (24 h) WT and Drp1−/− BMDMs obtained by flow cytometry in n = 3 biologically independent experiments. P values were calculated using two-way, unpaired t tests. i Quantification of mitochondrial DNA content in LPS/IFN-γ-activated WT and Drp1−/− BMDMs by qRT-PCR from n = 3 biological replicates. P value was obtained using two-way, unpaired t test (ns P > 0.05). j Measurement of mitochondrial membrane potential (TMRM) relative to MitoTrackerGreen in LPS/IFN-γ-treated WT and Drp1−/− BMDMs. Data represent n = 3 biological replicates. P value was obtained using two-way, unpaired t test. k Western Blot analysis showing the knock-out efficiency of Opa1−/− macrophages compared to WT BMDMs representative of n = 3 biological replicates l PGE2 levels produced by LPS/IFN-γ-activated WT or Opa1−/− BMDMs (24 h). Data represent n = 3 biologically independent replicates. P value was calculated using two-tailed, one-sample t test. All bars show mean ± SEM (b,d-j,l). Numerical P values are available in Supplementary Information Table 4 (*P ≤ 0.05, **P ≤ 0.01, ***P ≤ 0.001, ****P ≤ 0.0001, not significant (ns) P > 0.05). Source numerical data and unprocessed blots are available in source data.

