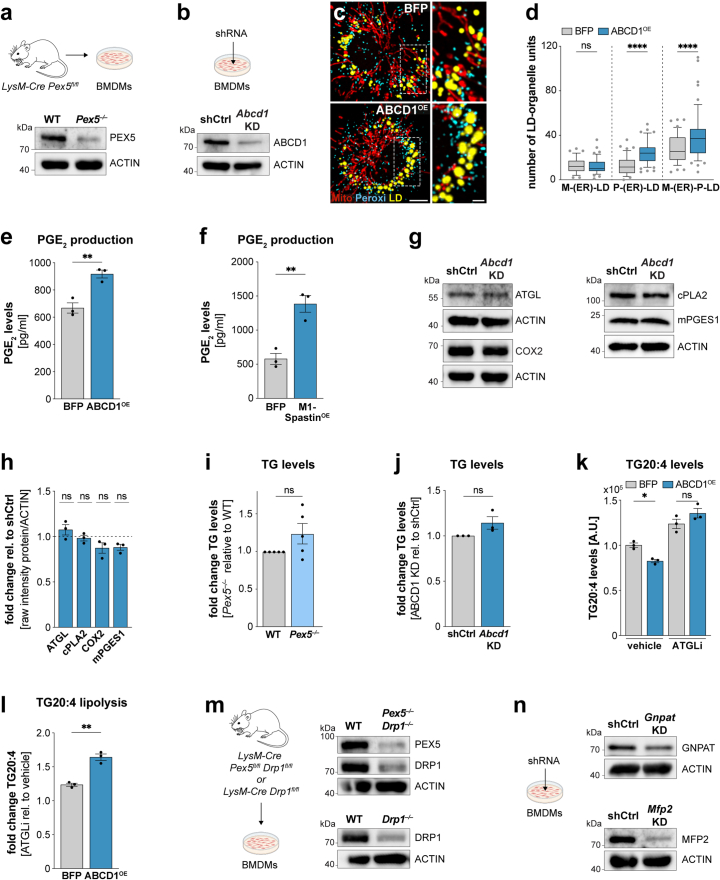
Extended Data Fig. 10. Increased peroxisome-LD tethering drives LD lipolysis and PGE2 production.
a,b Western Blot analysis showing the knock-out efficiency of Pex5−/− (a) and Abcd1 KD-efficiency (b) relative to control BMDMs representing n = 4;3 (Pex5−/−; Abcd1 KD) biological repeats. c,d Images (c) and quantification (d) of M-P-LD clusters in LPS/IFN-γ-activated (24 h) BMDMs upon ABCD1 expression. Images represent maximum intensity projections. Scale bars: 5 µm, 2 µm (magnification). Boxes represent 25th to 75th percentiles, whiskers 10th and 90th percentiles. Dots are outliers, the median is shown as a line. Data represent N = 48;53 (BFP; ABCD1) cells from n = 3 biological replicates. P values were obtained using one-way ANOVA with Sidak’s post-hoc test. e-f PGE2 levels of LPS/IFN-γ-treated (24 h) BMDMs expressing ABCD1 (e) or M1-Spastin (f) representing n = 3 biological replicates. P values were obtained using two-tailed, unpaired t tests (e,f). g,h Western Blot images (g) and quantification (h) showing protein levels of enzymes involved in FA release (ATGL, cPLA2) and PGE2 biogenesis (COX2, mPGES1) in LPS/IFN-γ-activated BMDMs upon Abcd1 KD. Data represent n = 3 biologically independent experiments (g,h). P values were obtained using two-tailed, one-sample t tests (h). i-j Triglyceride analysis showing TG levels in LPS/IFN-γ-activated (24 h) Pex5−/− (i) and Abcd1 KD BMDMs (j) relative to controls. Data represent n = 5;3 (i,j) biological replicates. P values were obtained using two-tailed, one-sample t tests. k,l TG arachidonic acid content (k) and release (k,l) of BFP and ABCD1 expressing cells from n = 3 biological replicates. P values were obtained using one-way ANOVA with Sidak’s post-hoc (k) and two-tailed, unpaired t tests (l) m Western Blot analysis showing the KO efficiency of Pex5−/− Drp1−/− and Drp1−/− BMDMs obtained from LysM-Cre Drp1fl/fPex5fl/fl and LysM-Cre Drp1fl/fl mice, respectively. Data represent n = 3 biological replicates n Western Blot analysis showing the efficiency of Mfp2 and Gnpat KD relative to control BMDMs representative of n = 2 independent repeats. All bars show mean ± SEM (e,f,h-l). Numerical P values are available in Supplementary Information Table 4 (*P ≤ 0.05, **P ≤ 0.01, ***P ≤ 0.001, ****P ≤ 0.0001, not significant (ns) P > 0.05). Source numerical data and unprocessed blots are available in source data.

