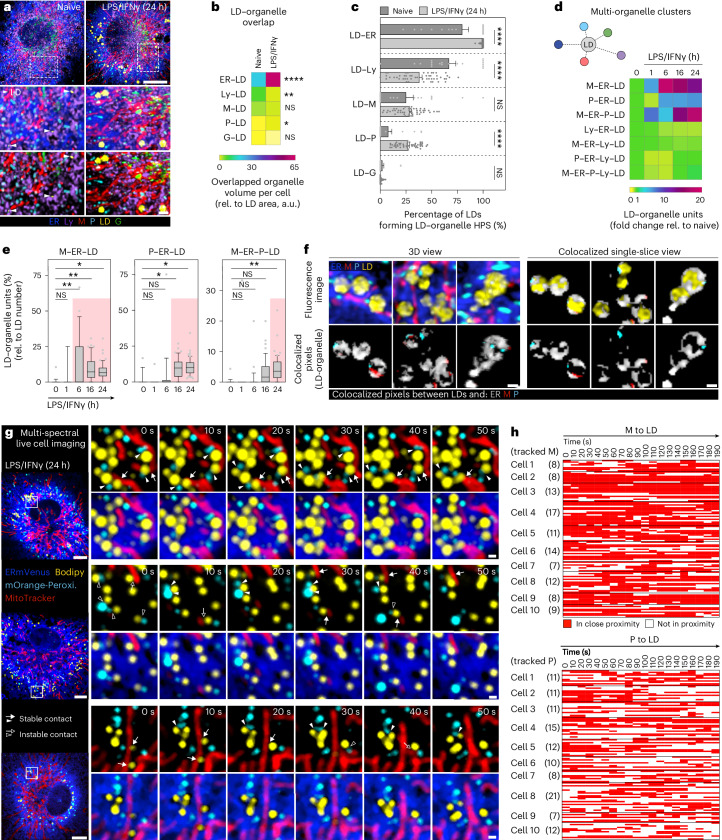
Fig. 2. Macrophages rewire their LD–interactome in response to inflammatory stimuli by selectively assembling M–ER–P–LD units.
a, Images of LDs and surrounding organelles in presence or absence of LPS/IFNγ (24 h). The arrowheads are the LDs in naive BMDMs. The organelles were visualized as described in (Fig. 1b,c). The images are maximum intensity projections and representative of n = 3 independent experiments. Scale bars, 5 µm (top) and 1 µm (bottom). b,c, Total overlapped volume between LDs and respective organelles relative to total LD surface area per cell (b) and pairwise LD–organelle HPS relative to LD number (c) in naive and LPS/IFNγ-treated (24 h) BMDMs. The data represent N = 19 (naive) and N = 51 (LPS/IFNγ) cells from n = 3 independent experiments. P values were obtained using Brown–Forsythe and Welch ANOVA with Dunnett’s post hoc (b) or one-way ANOVA with Sidak’s post hoc tests (c). Data are mean ± s.e.m. (c). a.u., arbitrary unit. d, LD-centric multi-organelle clusters upon LPS/IFNγ treatment (0–24 h). The data represent N = 17 (0 h, 1 h), N = 21 (6 h), N = 44 (16 h) and N = 51 (24 h) cells from n = 3 independent experiments. e, Upregulated LD multi-organelle clusters in inflammatory macrophages (as shown in d). The boxes represent the 25th to 75th percentiles and the whiskers denote the 10th and 90th percentiles. The dots are the outliers, and the median is shown as a line. The red colouring indicates significant changes. P values were generated using one-way ANOVA with Dunnett’s post hoc test. f, Co-localized pixels of LDs and respective organelles are depicted as a 3D overlay (left) or single z-planes (right). The data are representative of n = 3 independent experiments. Scale bars, 0.5 µm. g, Mitochondria–LD (arrows) and P–LD (arrowheads) interaction dynamics in LPS/IFNγ-treated BMDMs (24 h). The stable interactions are indicated with filled, instable interactions with empty arrows or arrow heads, respectively. The images represent single confocal z-planes from n = 3 biological repeats. Scale bars, 5 µm (left) and 0.5 µm (right). h, Mitochondria–LD (top) and P–LD (bottom) contacts. The rows represent individual organelles that are (red) or are not (white) in close proximity to LDs. The data representing N = 107 mitochondria and N = 118 peroxisomes were tracked across ten cells from n = 3 biological replicates. Numerical P values are available in Supplementary Table 4. *P ≤ 0.05, **P ≤ 0.01, ***P ≤ 0.001, ****P ≤ 0.0001. Source numerical data are available in Source data.

