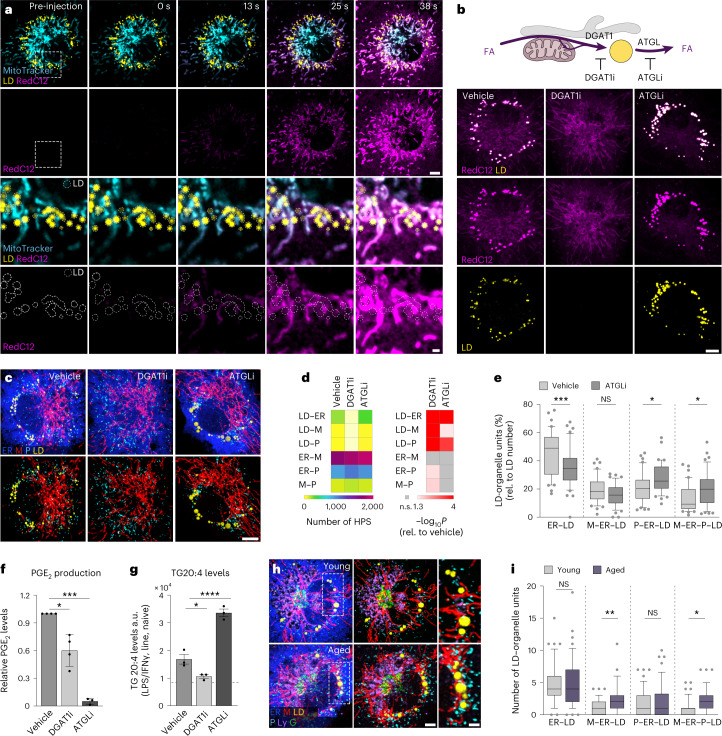
Fig. 3. M–ER–P–LD organelles form a fatty acid trafficking unit contributing to and sensing fatty-acid flux in and out of LDs.
a, Live cell imaging showing the flow of acutely injected fluorescently labelled fatty acids (RedC12, magenta) between M–ER–LD organelles in LPS/IFNγ-activated macrophages (24 h). Bottom: the dotted lines indicate LDs. The images represent n = 3 biological replicates. Scale bars, 5 µm (top) and 1 µm (bottom). b, RedC12 distribution (24 h pulse) inside and outside of LDs (Lipidspot610) of LPS/IFNγ-treated BMDMs after DGAT1 or ATGL inhibitor (DGAT1i or ATGLi) treatment. FA, fatty acids. The images represent n = 3 biological replicates. Scale bar, 5 µm. c–e, Images (c) and quantification of pairwise organelle HPS (d) and M–ER–P–LD units (e) in LPS/IFNγ-activated BMDMs (24 h) after DGAT1i (c,d) or ATGLi (c–e) treatment. Scale bar, 5 µm (c). The data represent N = 41 (vehicle), N = 42 (DGAT1i) and N = 41 (ATGLi) cells from n = 3 independent experiments. P values were obtained using one-way ANOVA with Dunnett’s post hoc test (d) or one-way ANOVA with Sidak’s post hoc test (e). f,g, PGE2 production (f) and TG arachidonic acid content (g) of LPS/IFNγ-activated BMDMs (24 h) after DGAT1i or ATGLi treatment. The data represent n = 4 (f, vehicle, DGAT1i) and n = 3 (f, ATGLi; g) independent experiments. Data are mean ± s.d. (f) and mean ± s.e.m. (g). P values were calculated using two-tailed, one-sample t-test (f) or one-way ANOVA with Sidak’s post hoc test (g). h,i, Images (h) and quantification (i) of M–ER–P–LD units in LPS/IFNγ-treated (24 h) peritoneal macrophages isolated from young and aged mice. Scale bars, 3 µm (left) and 2 µm (right) (h). Data represent N = 46 (young) and N = 47 (aged) cells from n = 3 biological replicates. P values were obtained using Kruskal–Wallis with Dunnett’s post hoc test. Box plots (e,i) are as in Fig. 2e. Images represent single confocal z-planes (a,b) or maximum intensity projections (c,h). The numerical P values are available in Supplementary Table 4. *P ≤ 0.05, **P ≤ 0.01, ***P ≤ 0.001, ****P ≤ 0.0001. Source numerical data are available in Source data.

