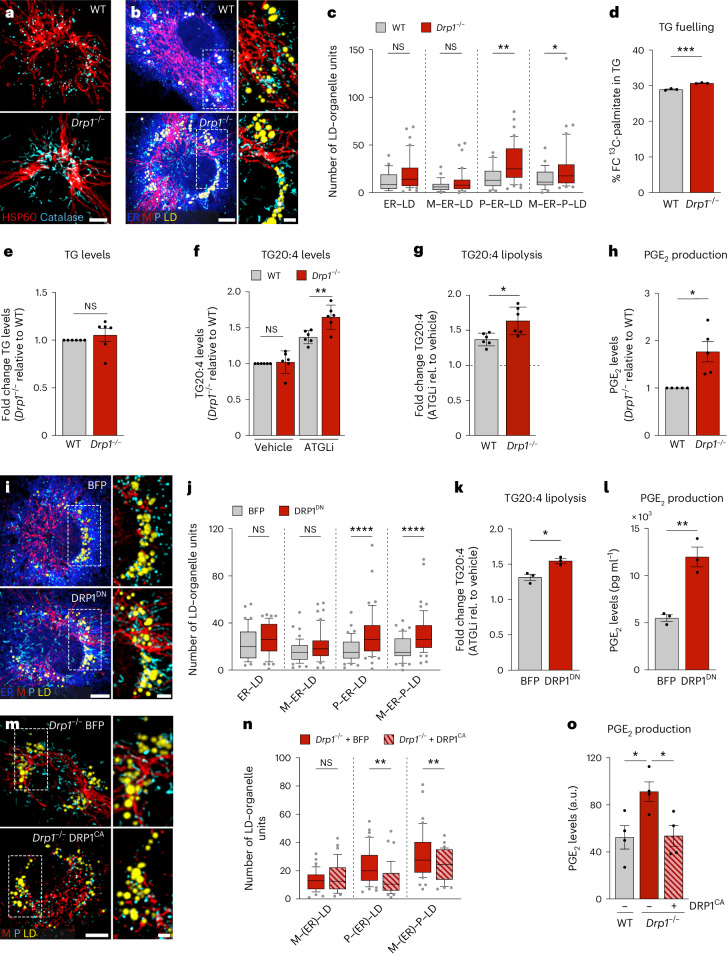
Fig. 5. DRP1 regulates M–ER–P–LD cluster formation and PGE2 production.
a, Images showing mitochondrial (red) and peroxisomal (cyan) morphologies in inflammatory Drp1−/− or wild-type (WT) BMDMs representing n = 3 biological replicates. b,c, Images (b) and quantification (c) of M–ER–P–LD clusters in LPS/IFNγ-activated Drp1−/− or wild-type BMDMs. The data represent N = 28 (WT) and N = 42 (Drp1−/−) cells from n = 3 biological replicates. P values were obtained using one-way ANOVA with Sidak’s post hoc test. d–g, TG analysis showing 13C-palmitate fuelling in TG (d), TG levels (e), TG arachidonic acid content (f) and release (f,g) in LPS/IFNγ-treated wild-type and Drp1−/− BMDMs (24 h) representative of n = 3 (d) or n = 6 (e–g) biological replicates. P values were obtained using a two-tailed, unpaired t-test (d,g), two-tailed, one-sample t-test (e) or one-way ANOVA with Sidak’s post hoc test (f). h, PGE2 production of LPS/IFNγ-activated wild-type or Drp1−/− macrophages (24 h) representing n = 5 biological repeats. P value was obtained using a two-tailed, one-sample t-test. i,j, Images (i) and quantification (j) of M–ER–P–LD clusters in LPS/IFNγ-activated DRP1DN expressing BMDMs. Data represent N = 48 (BFP) and N = 55 (DRP1DN) cells from n = 3 biological repeats. P values were obtained using a one-way ANOVA with Sidak’s post hoc test (j). k,l, TG arachidonic acid release (k) and PGE2 production (l) of BFP and DRP1DN expressing LPS/IFNγ-treated BMDMs (24 h). Data show n = 3 independent measurements. P values were obtained using two-tailed, unpaired t-tests (k,l). m,n, Images (m) and quantification (n) of M–ER–P–LD clusters in LPS/IFNγ-activated DRP1CA- or BFP-expressing Drp1−/− BMDMs. Data represent N = 42 (BFP) and N = 38 (DRP1DN) cells from n = 3 biological replicates. P values were obtained using one-way ANOVA with Sidak’s post hoc test (n). o, PGE2 production of LPS/IFNγ-treated wild-type BMDMs expressing BFP and Drp1−/− BMDMs expressing BFP or DRP1CA. Data show n = 4 biological replicates. P values were obtained using one-way ANOVA with Dunnett’s post hoc test. All images are maximum intensity projections. Scale bars, 5 µm and 2 µm (magnifications) (a,b,i,m). Box plots (c,j,n) are as in Fig. 2e. Data are mean ± s.e.m. (d,e,h,k,l) or mean ± s.d. (f,g). Numerical P values are available in Supplementary Table 4. *P ≤ 0.05, **P ≤ 0.01, ***P ≤ 0.001, ****P ≤ 0.0001. Source numerical data are available in Source data.

