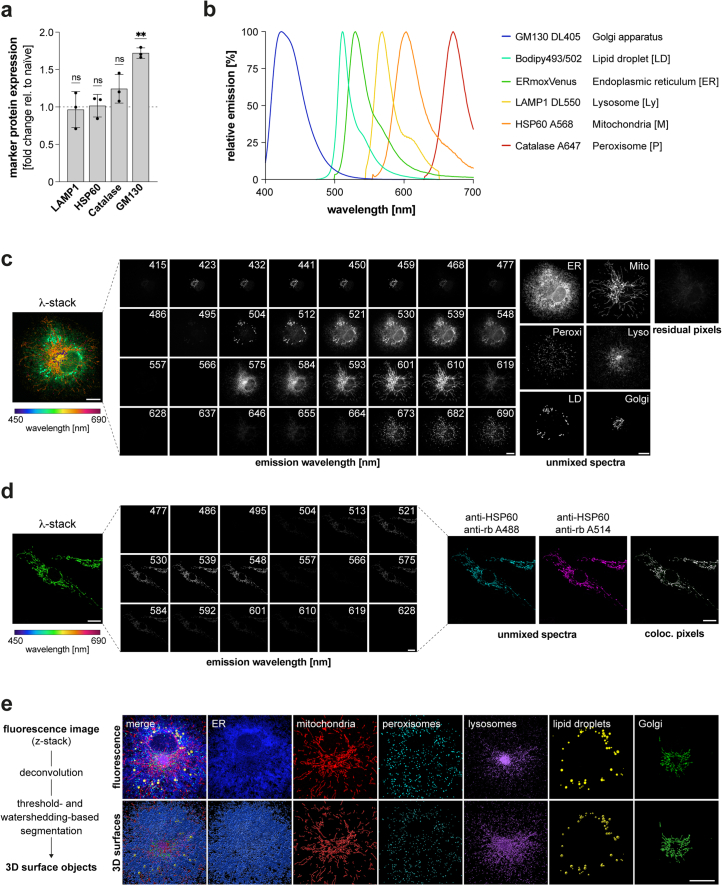
Extended Data Fig. 1. Spectral imaging strategy, image processing and segmentation.
a Expression of marker proteins used for spectral imaging in LPS/IFN-γ-treated (24 h) BMDMs relative to the control obtained by flow cytometry analysis. Bars show the mean ± SD of n = 3 biologically independent experiments. P values were obtained by two-tailed, one-sample t test (** P ≤ 0.01, not significant (ns) P >0.05). Numerical P values are indicated in Supplementary Information Table 4. b Emission spectra of fluorophores used for OrgaPlexing. c Immunofluorescence images of a 6-colour labelled BMDM displaying the emission spectra of individual organelles before (left) and after (right) spectral unmixing. All images are maximum intensity projections and representative of n = 4 independent experiments. Scale bars: 10 µm. d Verification of the unmixing strategy, shown by immunofluorescence of a BMDM displaying mitochondria (HSP60) labelled with A488 and A514 before (left, middle panel) and after (right, unmixed spectra) spectral unmixing as well as colocalized pixels between unmixed images (right, coloc. pixels). All images represent a single z-plane and representative of n = 3 experimental repeats. Scale bars: 10 µm. e Scheme depicting image processing and segmentation pipeline and images showing 3D surface objects generated for each organelle. Fluorescence images show maximum intensity projections and are representative of n = 4 independent experiments. Scale bar: 10 µm. Source numerical data are available in source data.

