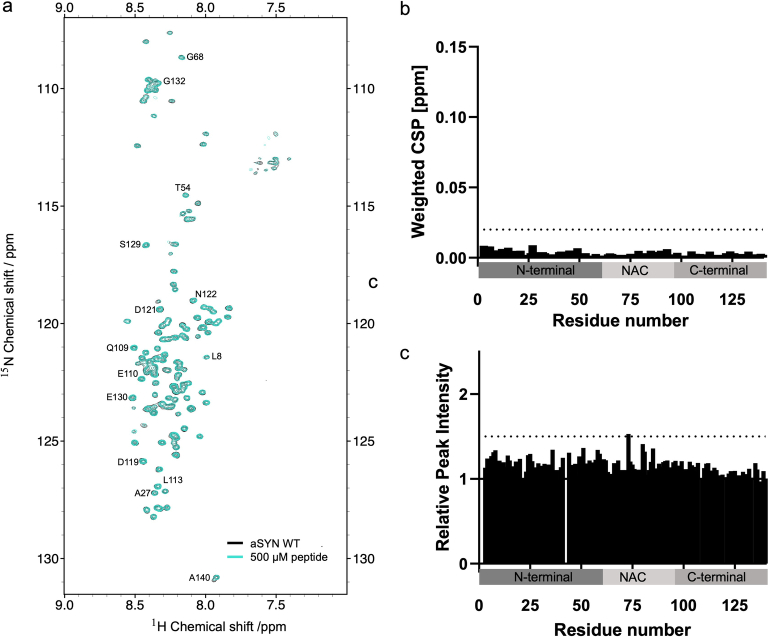
Extended Data Fig. 5. 1H-15N-BEST-TROSY spectra of aSYN in the presence of NT long peptide 1.
a) Overlapped 1H-15N-BEST-TROSY spectra of aSYN without (black) and in the presence (turquoise) of NT long peptide 1. aSYN concentration used: 40 µM, peptide concentration: 500 µM. b) Weighted average (of 15N and 1H) chemical shift perturbation (Δδ = √(δH2 + 0.2 (δ15N)2)) of residues in aSYN in the presence of 500 µM NT long peptide 1. Dashed line indicates Weighted CSP of 0.02 ppm. c) Relative peak intensities of aSYN residues in the presence of 500 µM NT long peptide 1. Black dashed line indicates Relative Peak Intensity of 1.5.

