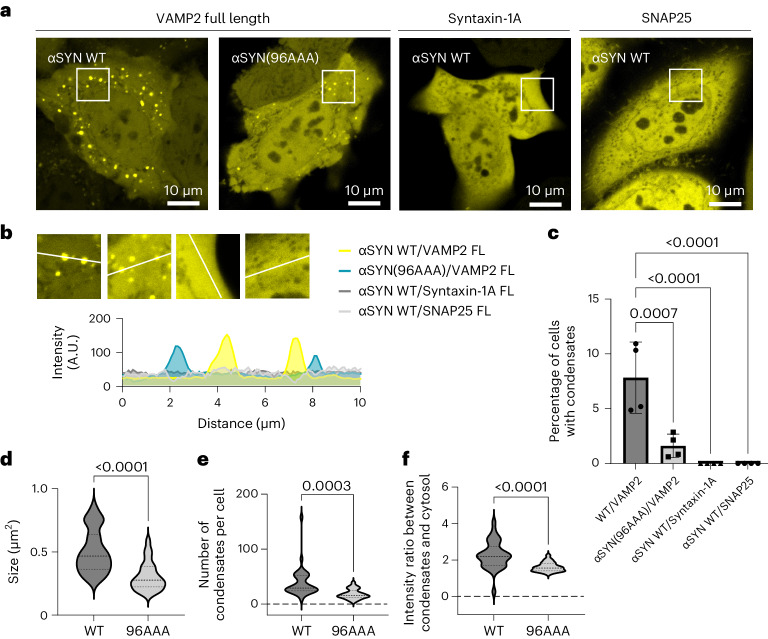
Fig. 3. αSYN–VAMP2 interaction regulates αSYN condensate formation.
a, Condensate formation for wild-type (WT) αSYN–YFP and αSYN(96AAA)–YFP upon co-expression with VAMP2. Wild-type αSYN–YFP co-expressed with syntaxin-1A or SNAP25 does not show condensate formation. b, Zoomed-in regions and fluorescence intensity distribution for cells with co-expression of wild-type αSYN–YFP with VAMP2 (yellow), αSYN(96AAA)–YFP with VAMP2 (turquoise), and wild-type αSYN–YFP with syntaxin-1A (dark grey) and SNAP25 (light grey). c, Quantification of cells forming condensates. Data are derived from Incucyte screening, with 16 images per well, three wells per biological repeat and four biological repeats; n indicates biological repeats. Data are mean ± s.d. One-way ANOVA with Dunnett’s multiple comparison test. d, Quantification of condensate size for cells co-expressing wild-type αSYN–YFP and αSYN(96AAA)–YFP with VAMP2. Data are represented as violin plots, n = 33 and 26 cells for WT and 96AAA, respectively, pooled from three biological repeats. Unpaired two-tailed t-test. e, Quantification of condensates per cell for cells co-expressing wild-type αSYN–YFP and αSYN(96AAA)–YFP with VAMP2. mData are represented as violin plots, n = 33 and 26 cells for WT and 96AAA, respectively, pooled from three biological repeats. Unpaired two-tailed t-test. f, Quantification of the intensity ratio between condensates and cytosolic αSYN–YFP for cells co-expressing wild-type αSYN–YFP and αSYN(96AAA)–YFP with VAMP2. Data are represented as violin plots., n = 33 and 26 cells for WT and 96AAA, respectively, pooled from three biological repeats. Unpaired two-tailed t-test.

