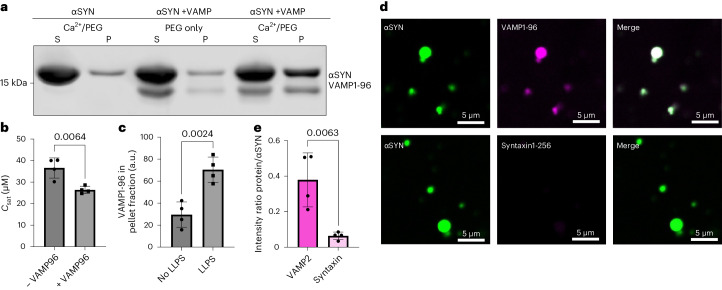
Fig. 4. VAMP1-96 promotes αSYN phase separation in vitro.
a, Sedimentation-based assay showing supernatant (S, dilute phase) and pellet (P, droplet phase) fraction upon αSYN phase separation in the presence of Ca2+ (concentrations used: 40 µM αSYN, 2 mM Ca2+, 15% PEG 8000), upon αSYN and VAMP1-96 incubation (40 µM αSYN, no Ca2+, 10 µM VAMP1-96, 15% PEG 8000) and αSYN phase separation in the presence of VAMP1-96 (40 µM αSYN, 2 mM Ca2+, 10 µM VAMP1-96, 15% PEG 8000). b, Quantification of saturation concentration (Csat) of αSYN phase separation in the presence of 2 mM Ca2+ (–VAMP) and 2 mM Ca2+ with 10 µM VAMP1-96 (+VAMP). Data derived from four biological repeats; n indicates biological repeats. Data are mean ± s.d. Unpaired two-tailed t-test. c, Quantification for the intensity of VAMP1-96 in the pellet fraction, either under no phase separation (40 µM αSYN, no Ca2+, 10 µM VAMP1-96, 15% PEG) or under αSYN phase separation conditions in the presence of Ca2+ (40 µM αSYN, 2 mM Ca2+, 10 µM VAMP1-96, 15% PEG). Data derived from four biological repeats; n indicates biological repeats. Data are mean ± s.d. Unpaired two-tailed t-test. d, Co-localization of VAMP1-96 or syntaxin1-265 with αSYN droplets induced in the presence of 2 mM Ca2 and 15% PEG 8000. Co-localization was evaluated 30 min after induction of αSYN phase separation and addition of the respective labelled protein. αSYN was used at 100 µM. e, Quantification of co-localization showing intensity ratio of VAMP1-96 and syntaxin1-265 to αSYN after 30 min. Data derived from four biological repeats; n indicates biological repeats. Data are mean ± s.d. Unpaired two-tailed t-test.

