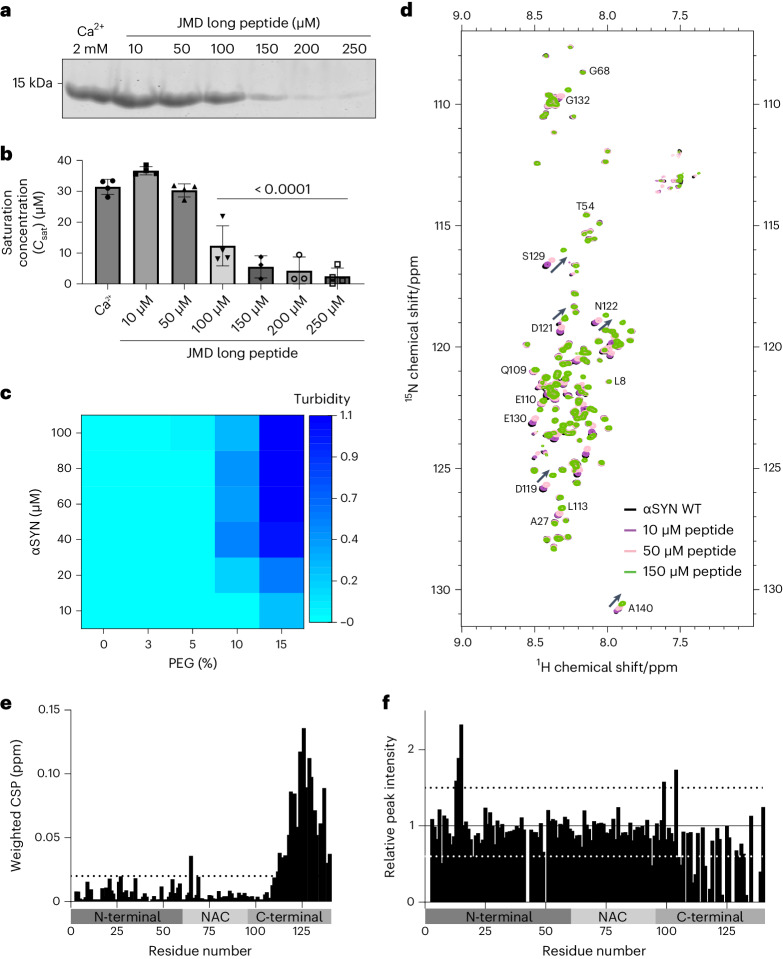
Fig. 6. The JM domain of VAMP2 interacts with αSYN.
a, Sedimentation-based assay showing supernatant (dilute phase) upon αSYN phase separation in the presence of the JMD long peptide (40 µM αSYN, 15% PEG 8000, concentrations of peptide as indicated). b, Quantification of Csat of αSYN phase separation in the presence of the JMD long peptide. Data are mean ± s.d., n represents three biological repeats for 150 µM and 200 µM peptide and four biological repeats for all other conditions. One-way ANOVA with Dunnett’s multiple comparison test. c, Heatmap showing turbidity measurements of αSYN phase separation in the presence of 150 µM JMD long peptide. Data represent three biological repeats. See also Extended Data Fig. 4 for αSYN droplet formation in the presence of 150 µM JMD long peptide at lower PEG concentrations. d, Overlapped 1H-15N-BEST-TROSY spectra of αSYN without (black) and in the presence of increasing concentrations of JMD long peptide as indicated. Also see Extended Data Fig. 5a for the 1H-15N-BEST-TROSY spectra of αSYN in the presence of NT long peptide 1. αSYN concentration was 40 µM and peptide concentrations were 10 µM, 50 µM and 150 µM. e, Weighted average (of 15N and 1H) chemical shift perturbation (Δδ = √(δH2 + 0.2 (δ15N)2)) of residues in αSYN in the presence of 150 µM JMD long peptide. Also see Extended Data Fig. 5b weighted average (of 15N and 1H) chemical shift perturbation in the presence of NT long peptide 1. Dashed line indicates weighted CSP of 0.02 ppm. f, Relative peak intensities of αSYN residues in the presence of 150 µM JMD long peptide. Also see Extended Data Fig. 5c for relative peak intensities of αSYN residues in the presence of NT long peptide 1. The black dashed line indicates a relative peak intensity of 1.5 and the white dashed line indicates a relative peak intensity of 0.6.

