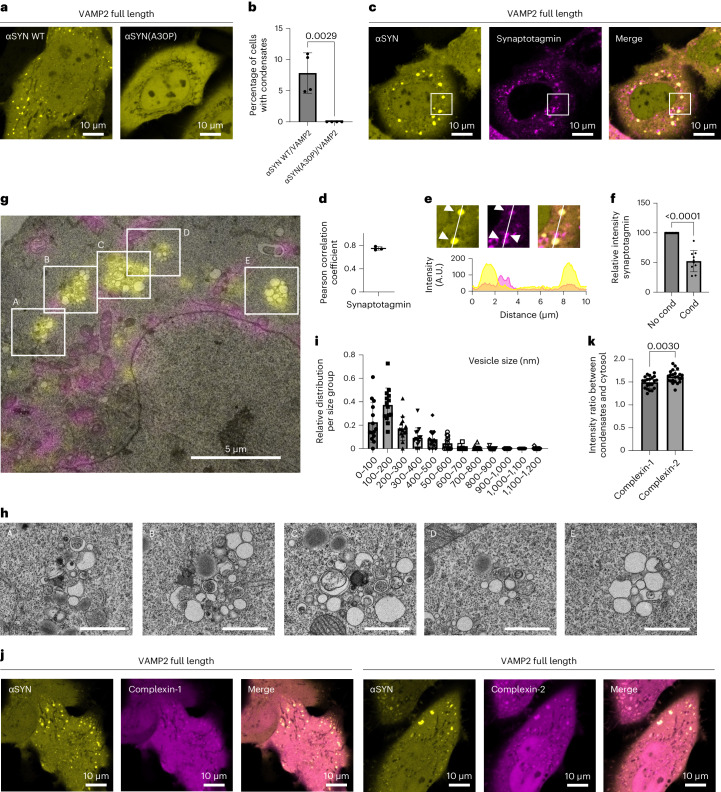
Fig. 7. αSYN condensate formation is dependent on αSYN lipid membrane binding and attracts vesicles and protein partners.
a, Co-expression of VAMP2 and wild-type αSYN–YFP in HeLa cells showing condensate formation. Cells co-expressing VAMP2 and αSYN(A30P)–YFP lack condensate formation. b, Quantification of cells forming condensates. Data are derived from Incucyte screening, with 16 images per well, three wells per biological repeat and four biological repeats. n indicates biological repeats. Data are mean ± s.d. One-way ANOVA with Dunnett’s multiple comparison test. c, Co-expression of αSYN–YFP, VAMP2 and mScarlet synaptotagmin showing partial co-localization of mScarlet synaptotagmin with αSYN–YFP condensates. d, Quantification of Pearson correlation coefficient for αSYN–YFP and mScarlet synaptotagmin co-localization. Three biological repeats were conducted; n indicates biological repeats. Data are mean ± s.d. Unpaired two-tailed t-test. e, Zoomed-in areas highlighting co-localization of αSYN condensates with co-expressed mScarlet synaptotagmin and mScarlet synaptotagmin outside αSYN condensates. Fluorescence intensity distribution for αSYN–YFP (yellow) and mScarlet synaptotagmin (magenta). f, Quantification of mScarlet synaptotagmin intensity outside and within αSYN condensates. n = 10 cells, pooled from four biological repeats. Data are mean ± s.d. Unpaired two-tailed t-test. g, HeLa cells with ectopic expression of αSYN–YFP, VAMP2 and 4xMTS-mScarlet, electron microscopy image overlaid with fluorescence microscopy, showing assemblies of vesicles colocalizing with αSYN–YFP condensates. Also see Extended Data Fig. 6 for individual images. h, Electron microscopy images for individual vesicle clusters in Fig. 7g. Scale bar, 1 µm. i, Histogram showing size distribution of vesicles contained within αSYN condensates. Data are mean ± s.d. n = 14 vesicle clusters pooled from two cells from two biological repeats. j, Co-expression of αSYN–YFP, VAMP2 and complexin-1/2 mScarlet demonstrating enrichment of complexins within αSYN–YFP condensates. k, Quantification of complexin in αSYN condensates versus cytosolic complexin levels. Complexin-2 levels were significantly higher than complexin-1. n = 21 and 23 cells for complexin-1 and complexin-2, respectively, pooled from three biological repeats. Data are mean ± s.d. Unpaired two-tailed t-test.

