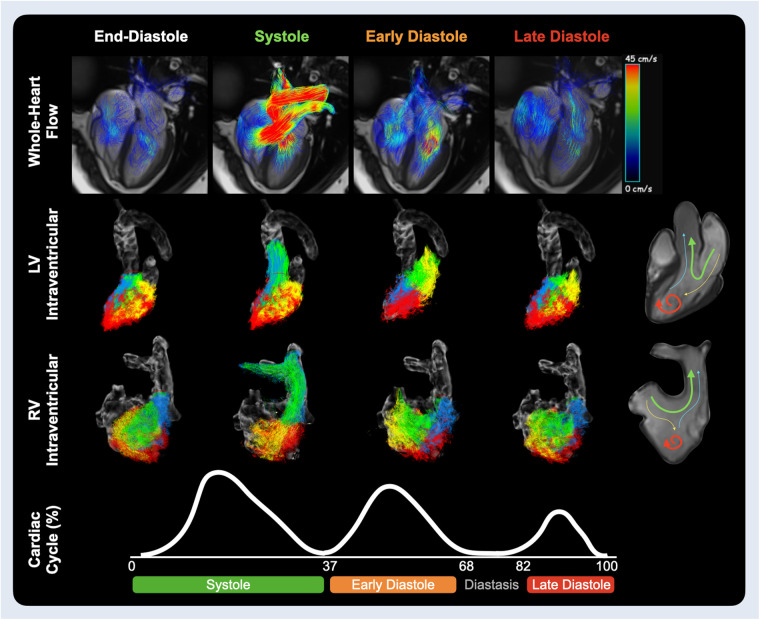
Figure 2.
Ventricular hemodynamics. Velocity path lines through the heart are shown on the top row for the end-diastolic phase, mid systole and at the peak inflow of early and late diastole. The middle rows show the ventricular components for the left and right heart respectively. These flow components include direct flow (green), blood that enters and leaves the ventricle during the same heartbeat; retained inflow (yellow), blood that enters the ventricle but is only ejected during the next heartbeat; delayed ejection (blue), blood that is being ejected but entered from the previous heartbeat; and residual volume (red), blood that stays for at least two or more heartbeats within the ventricle. The sum of all four components provides global intraventricular measurements. Timing of systolic, early and late diastolic waves are acquired from the average wave duration of aortic and mitral flow analysis of 32 healthy controls (Supplementary Results).

