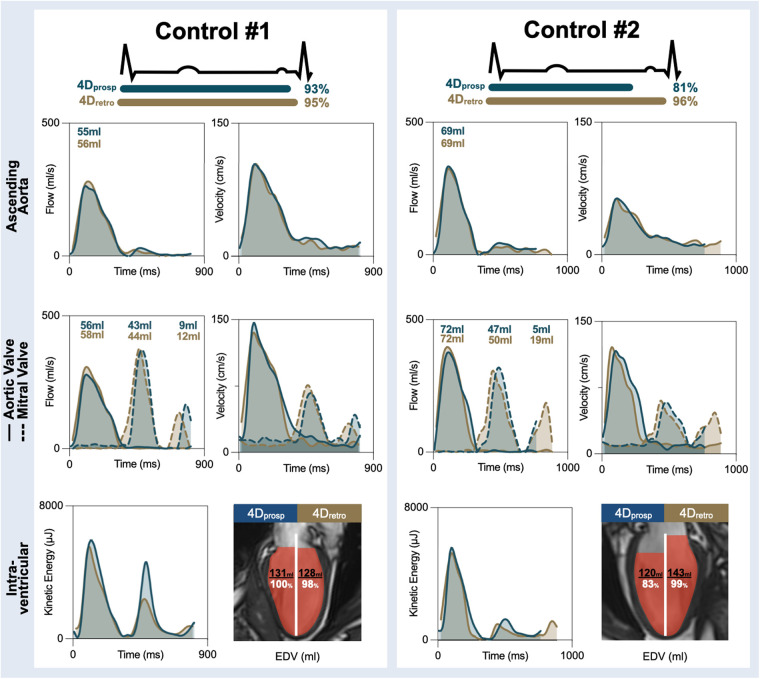
Figure 3.
Healthy control examples. Measurements across the cardiac cycle are shown for flow and velocity in the ascending aorta (top), through the aortic valve (solid line) and mitral valve (dotted line) for both the prospectively gated (4Dprosp, blue) and retrospectively gated (4Dretro, gold) 4D flow. Total effective volume per wave is shown for the flow curves. The bottom row depicts global kinetic energy and the total end-diastolic volume (EDV) detected by 4D flow in comparison to EDV measured by standard volume analysis from cine images. In both controls, measures during the systolic phase of the cardiac cycle depict a significant overlap. In control #1, 93% of the cardiac cycle was acquired with the 4Dprosp and the A-wave can be observed with transmitral flow and velocities and intraventricular kinetic energy resulting in similar EDV. In control #2, only 81% of the cycle was obtained and a significant portion of the A-wave was lost. As a result, EDV was underestimated by the 4Dprosp.

