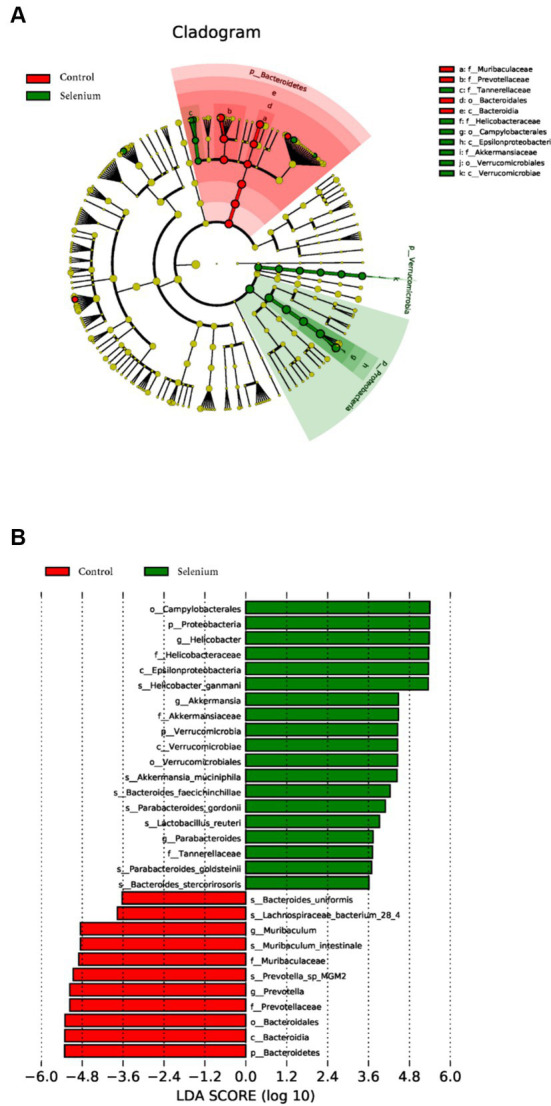
Figure 7.

Gut microbiota profiles in the selenium intervention group. The results show cells that differ significantly across taxonomic levels. (A) The cladogram generated from the LEfSe analysis indicates the phylogenetic distribution of the microbiota of the selenium intervention group and control group from phylum to genus. (B) Histogram of LDA scores to identify differentially abundant bacteria between the selenium intervention group and control group (LDA score > 2.0).
