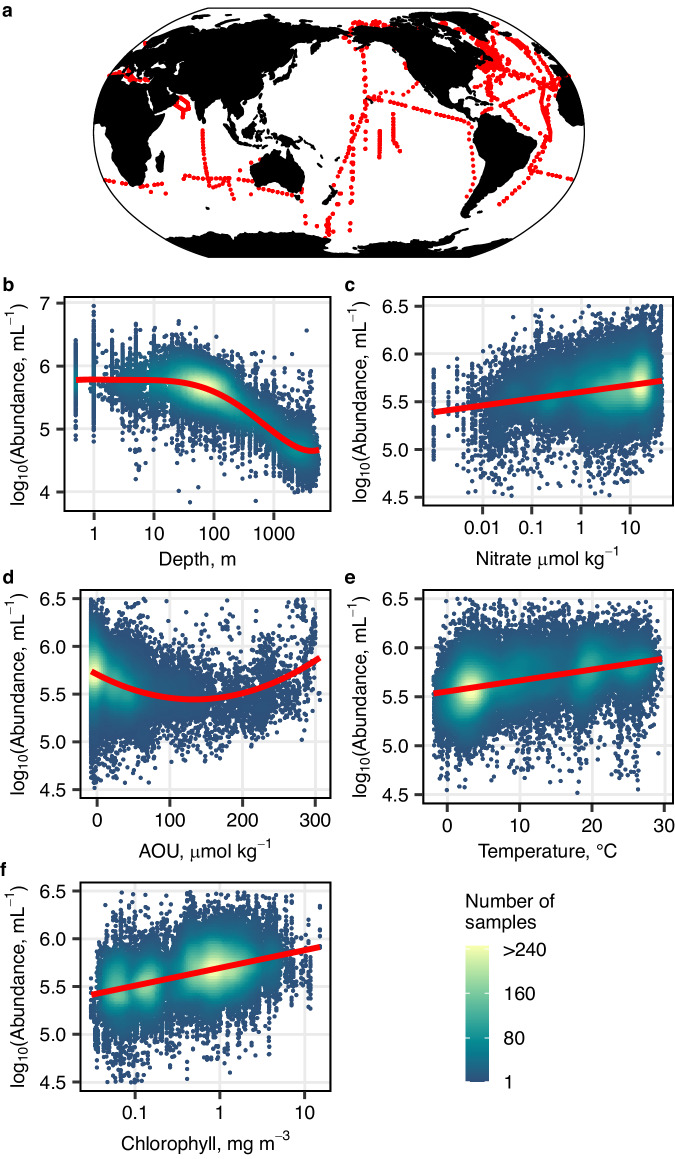
Fig. 1. Prokaryotic abundance statistical model.
a Distribution of 41,718 in situ unique samples of heterotrophic bacterial and archaeal abundance that were used in this study. The main effects of different environmental variables in our final parametric model of prokaryotic abundance (holding all other covariates constant), are shown as log10 prokaryotic abundance (mL−1) versus b log10 depth (m), c log10 nitrate (μmol kg−1), d apparent oxygen utilization (AOU; μmol kg−1), e temperature (°C) and f log10 chlorophyll (mg m−3). The red line is the fitted response for each environmental variable, with partial residuals shown as dots colored by the number of samples. Source data are provided as a Source Data file.

