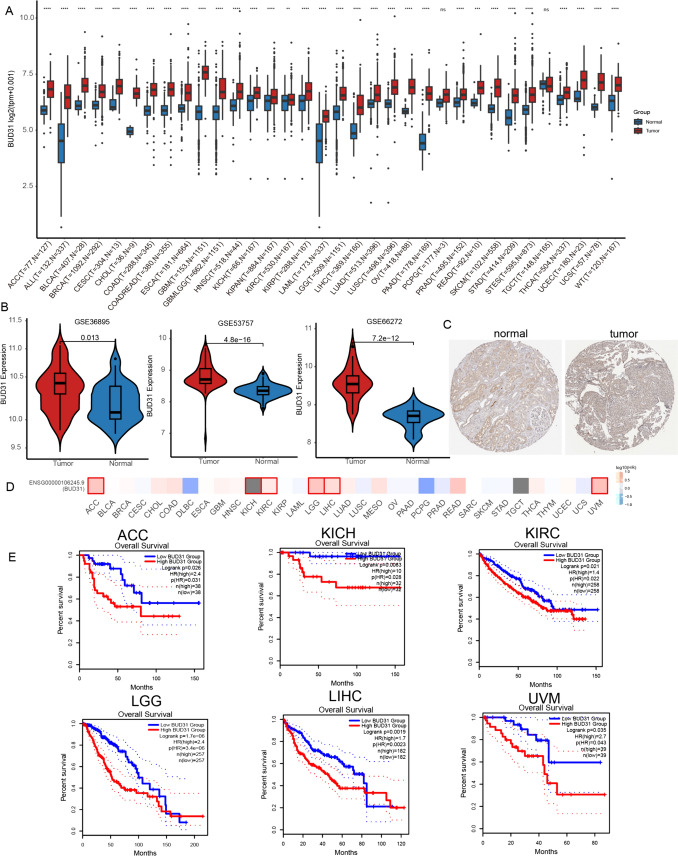
Figure 1.
Differential expression and prognostic value of Bud31 in various malignancies. A Expression profile of Bud31 across multiple cancer types, depicted as box plots. Data are segregated into normal (blue) and tumor (red) groups for each study identifier. B Violin plots illustrating the distribution of Bud31 expression in normal versus tumor samples from three independent datasets, with p-values indicating statistical significance. C Comparative immunohistochemical analysis of Bud31 protein levels in normal (left) and neoplastic (right) tissue sections. D Heatmap correlation matrix of Bud31 expression levels across different cancer subtypes, with intensity gradients representing expression magnitude. E Kaplan–Meier survival plots evaluating the correlation between Bud31 expression and overall survival in six distinct cancer cohorts, stratified by high (red) and low (blue) expression levels, accompanied by p-values and hazard ratios. * P < 0.05, **P < 0.01, ***P < 0.001

