Fig. 3.

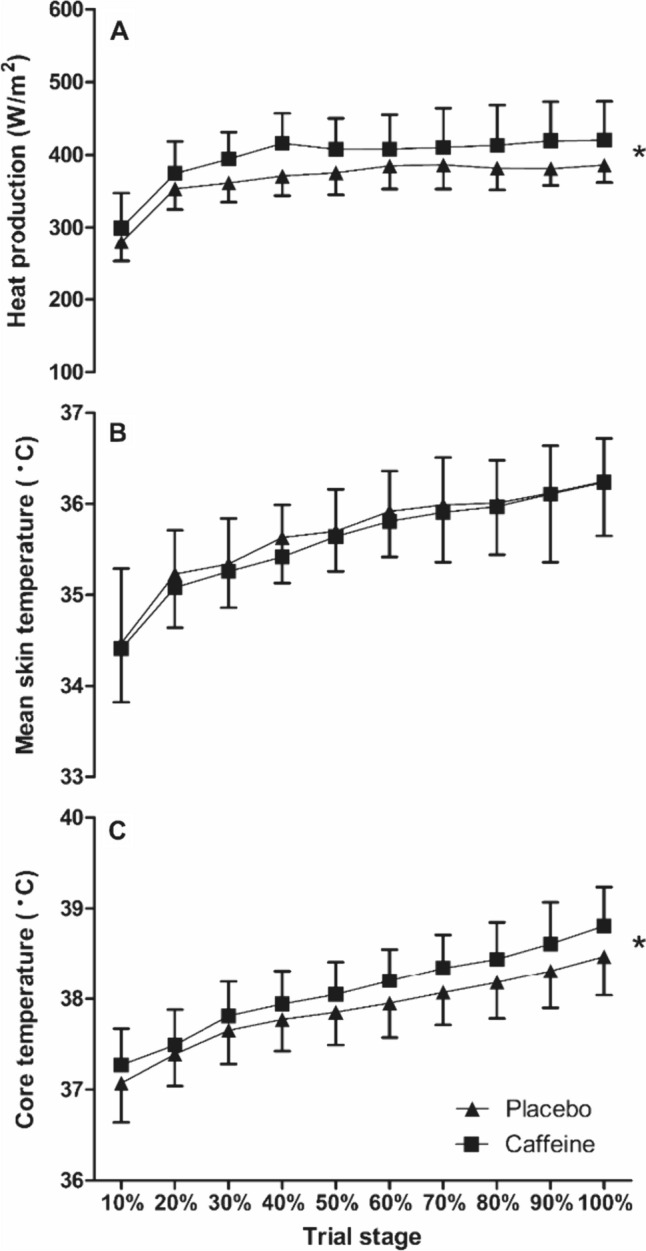
Core temperature (C), mean skin temperature (B) and heat production (A) during the time-to-exhaustion trial in the heat between caffeine and placebo conditions (mean ± SD). * = condition effect, denoting higher in caffeine (P < 0.05)

Core temperature (C), mean skin temperature (B) and heat production (A) during the time-to-exhaustion trial in the heat between caffeine and placebo conditions (mean ± SD). * = condition effect, denoting higher in caffeine (P < 0.05)