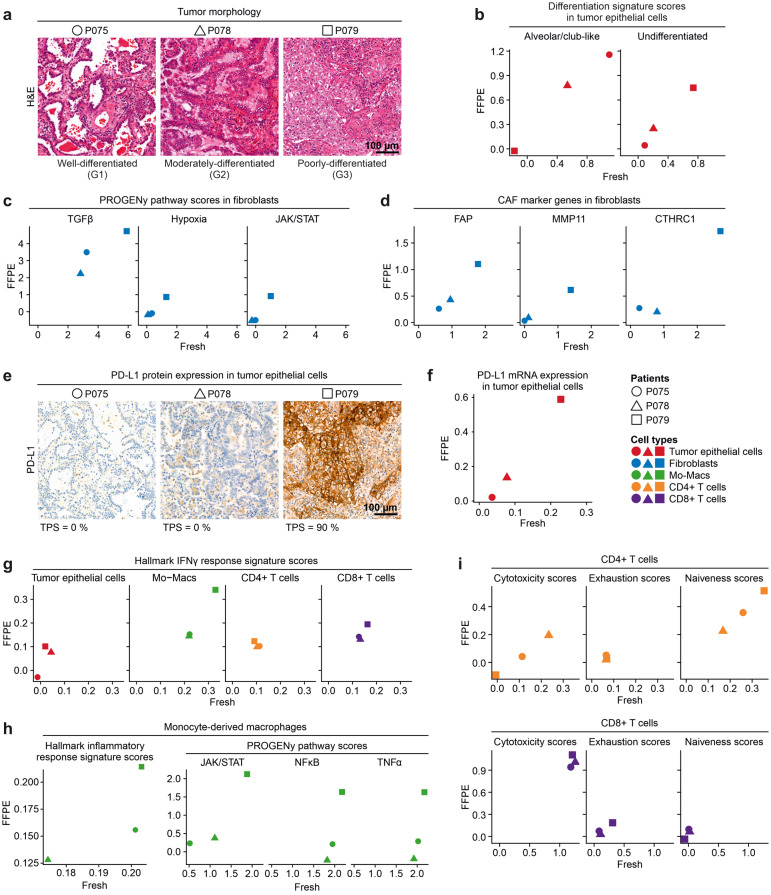
Fig. 4.
Quantification of clinically relevant gene expression patterns in fresh versus FFPE single-cell analysis. a Hematoxylin and eosin stained FFPE tumor sections of patients P075, P078, P079, showing a predominant lepidic, acinar or solid growth pattern, respectively, corresponding to well-differentiated (G1), moderately-differentiated (G2) or poorly-differentiated (G3) tumor morphology and grade, as indicated. b Correlation between FFPE and fresh tissue of Alveolar/club-like and Undifferentiated tumor cell signature scores in tumor epithelial cells. c Correlation between FFPE and fresh tissue of PROGENy pathway scores in fibroblasts. d Correlation between FFPE and fresh tissue of CAF marker expression in fibroblasts. e Immunohistochemistry on FFPE tumor section for PD-L1 expression. TPS: Tumor proportion score. f Correlation between FFPE and fresh tissue of PD-L1 gene expression in tumor epithelial cells. g Correlation between FFPE and fresh tissue of Interferon Gamma Response Hallmark gene signature scores in various cell types, as indicated. Mo-Macs = Monocyte-derived macrophages. h Correlation between FFPE and fresh tissue of clinically and biologically relevant signature scores in Mo-Macs, as indicated. i Correlation between FFPE and fresh tissue of functional cell state scores in CD4+ and CD8+ T cells, as indicated

