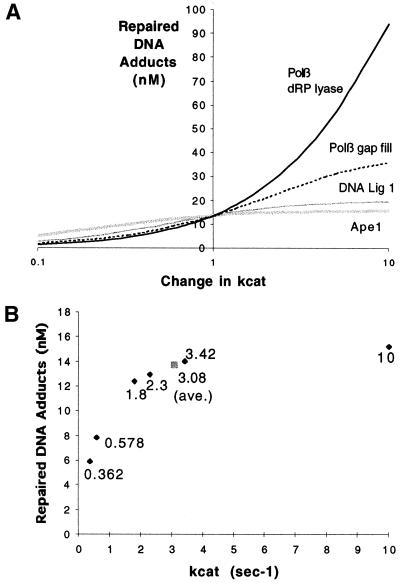
Figure 4.
Sensitivity of the abasic site repair model (shown in Fig. 2) to changes in kcat of each reaction. (A) The final number of repaired DNA adducts (after 120 s) upon varying kcat by an order of magnitude either more or less than the average value used in the original simulation (Table 1). (B) Predicted abasic site repair (after 120 s, 1 µM initial damage) for six different experimentally measured Ape1 incision kcat parameters (Table 2) and their average (gray box). The points are labeled with the kcat value.

