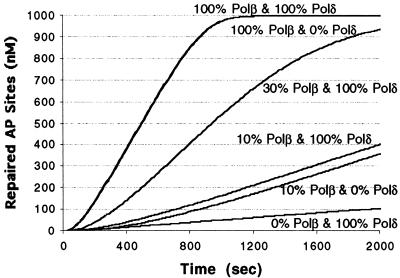
Figure 6.
Simulation of the effect AP site repair of inhibiting DNA polymerase activities. The initial AP site concentration was 1 µM by varying Polβ/δ concentrations. The curves at various Polβ and Polδ concentrations (with 100% representing 19.8 nM, the assumed normal cellular concentration) are indicated. Note that the curves for 100%/100% Polβ/δ and 100%/0% Polβ/δ overlap.

