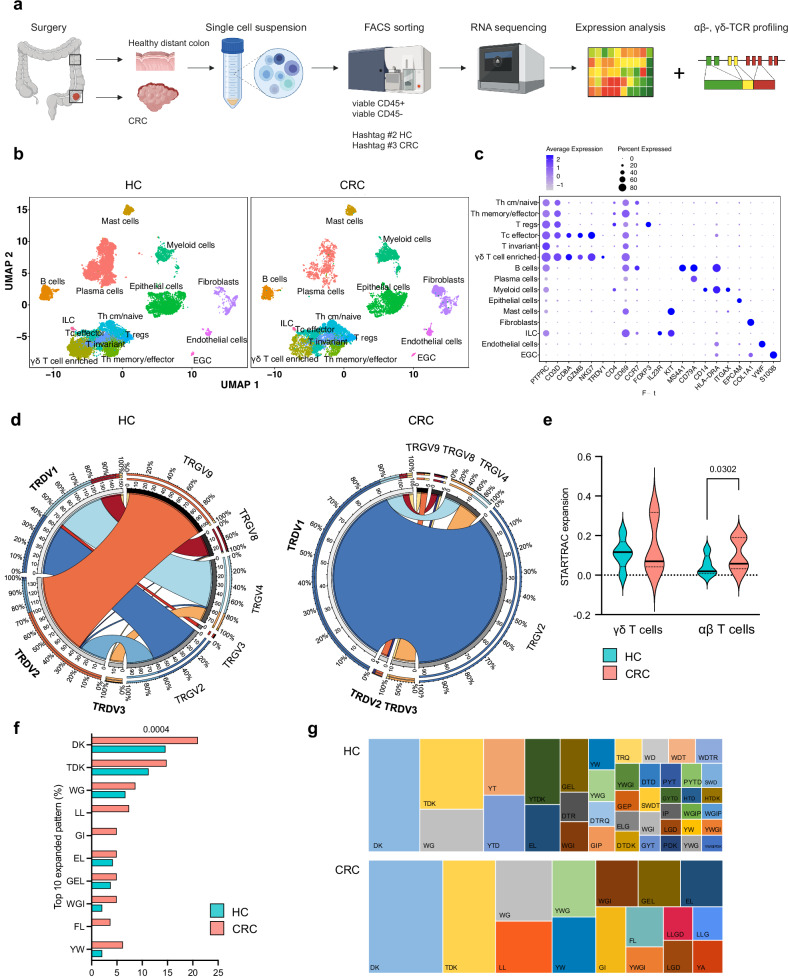
Fig. 1. Single-cell RNA- and TCR sequencing reveal favored Vδ1+ usage with expanded CDR3 identity patterns in γδ T cells of MSS CRC.
CD45 + /CD45– cells were sorted from human MSS CRC and distant HC of resection tissue and processed for 10X genomics RNA and αβ-, γδ-TCR sequencing. a Graphical abstract of the work flow. CRC tissue and healthy distant colon was obtained from 17 and 16 patients, respectively. Single-cell RNA-sequencing and αβ-/γδ-TCR sequencing were performed from seven patients. b UMAP of cells in HC and CRC displayed according to the similarity of their transcriptome. c Marker genes of depicted cell subsets. d Circos plots displaying chain pairing of TRDV and TRGV in HC compared to CRC. e STARTRAC expansion index of γδ T cells (left) and αβ T cells (right). αβ T cells but not γδ T cells showed an increasing index indicative of antigen-specific clonal expansion. f Percentage of top 10 expanded patterns of identity in the CDR3 region of γδ T cells in CRC and corresponding HC using GLIPH219. g Visual comparison of tree map graphs showing the identity pattern in the CDR3 region of γδ T cells in HC and CRC. In tree maps, each rectangle reflects a unique pattern, as indicated, where the size of a spot equals the percentage. Violin plots display median and quartiles (e); two-tailed paired t-test (e, f). EGC, enteric glial cells. ILC, innate lymphoid cells. p values are shown on the graphs.

