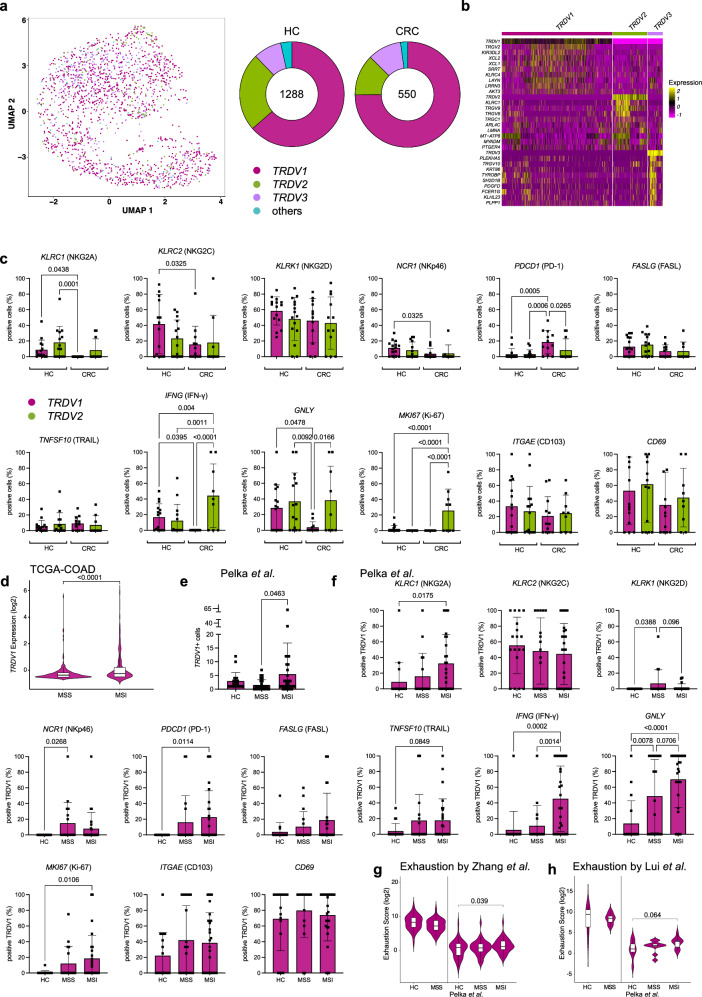
Fig. 2. TRDV1+ cells demonstrate profound dysregulation but not exhaustion in MSS CRC.
γδ T cells subsets were analyzed according to the expression of marker genes TRDV1, TRDV2 and TRDV3. (a) UMAP based on the expression of TRDV1, TRDV2 and TRDV3 in HC and CRC. On the right side, donut charts illustrating the quantities of cells, indicating the counts of TRDV1, TRDV2 and TRDV3 expressing cells in both HC and CRC. b Top 10 differentially overexpressed genes for each subset TRDV1, TRDV2 and TRDV3. c Expression of individual genes displayed as percentage of positive cells for TRDV1 and TRDV2 in HC and CRC reveal distinct effector states of both subsets (n = 16 for HC, n = 17 for CRC). d Expression of TRDV1 in MSI and MSS of TCGA-COAD (n = 217 for MSS, n = 121 for MSI). e TRDV1+ cells per sample in HC, MSS CRC and MSI CRC in the Pelka et al. data set20 (n = 36 for HC, n = 34 for MSI, n = 28 for MSS). f Expression of individual genes displayed as percentage of positive cells for TRDV1 in HC, MSS CRC and MSI CRC using Pelka et al. (n = 36 for HC, n = 28 for MSS, n = 34 for MSI). g, h Depiction of exhaustion scores using genes sets by Zhang et al.21. and Lui et al.22. as previously published of TRDV1+ cells in HC and CRC (left: n = 16 for HC, n = 17 for CRC, right: n = 36 for HC, n = 28 for MSS, n = 34 for MSI). Data points and error bars represent the mean ± SD (c, e, f), Violin plots display median, quartiles ±SD (d, g, h); one-way ANOVA with Fisher’s LSD (c, f), two-tailed unpaired t-test (d, e, g, h). p values are shown on the graphs.

