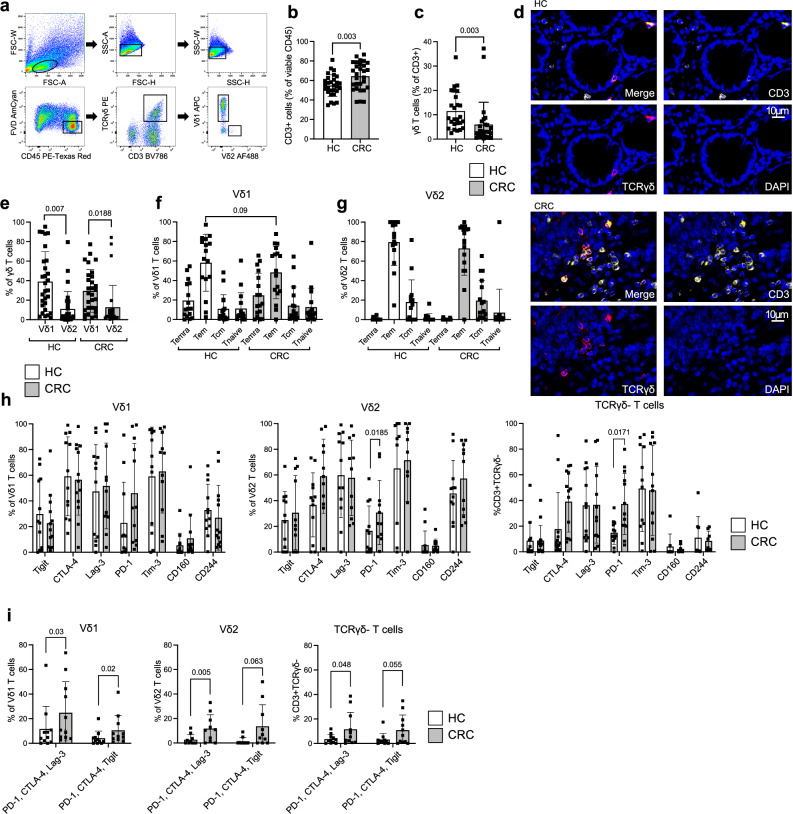
Fig. 3. γδ T cells are reduced in MSS CRC compared to HC and upregulate co-expression of inhibitory receptors.
Flow cytometry analysis of γδ T cell abundance and subsets in human MSS CRC compared to HC. a Gating strategy for γδ T cells from human mononuclear cells isolated from CRC. b Significant increase in CD3+ cells depicted as mean percentage of viable CD45+ cells in CRC compared to HC (n = 29 per group). c Significant decrease of TCRγδ + cells in CRC depicted as mean percentage of viable CD3+ cells compared to HC (n = 29 per group). d Representative image of multicolor fluorescent immunohistochemistry staining of TCRγδ + cells (TCRγδ PE/ CD3 A647) in HC and CRC. e Significantly more Vδ1 + populate HC and CRC compared to Vδ2 + , assessed by flow cytometry and depicted as percentage of positive cells of viable TCRγδ + CD3 + cells (n = 29 per group). Vδ1 + (f) and Vδ2 + (g) display different T cell effector states according to their CD27 and CD45RA expression (n = 16 per group). Temra: CD45RA + CD27–, Tem: CD45RA–CD27–, Tcm: CD45RA–CD27 + , Tnaive: CD45RA + CD27 + . h Expression of inhibitory checkpoint receptors on Vδ1 + (n = 13), Vδ2 + (n = 11) and TCRγδ negative T cells (n = 13) in HC (white) and CRC (gray). i Co-expression of depicted receptors on Vδ1 + , Vδ2 + and TCRγδ negative T cells in HC (white) and CRC (gray; n = 11 per group). Co-expression was assessed by first gating on PD-1+ cells and then calculating the percentage of double-positive cells. Data points and error bars represent the mean ± SD (b, c, e−i); two-tailed paired t-test (b, c, e, i), one-way ANOVA with Fisher’s LSD (f−h); Temra, effector memory RA; Tem, effector memory; Tcm, central memory. p values are shown on the graphs.

