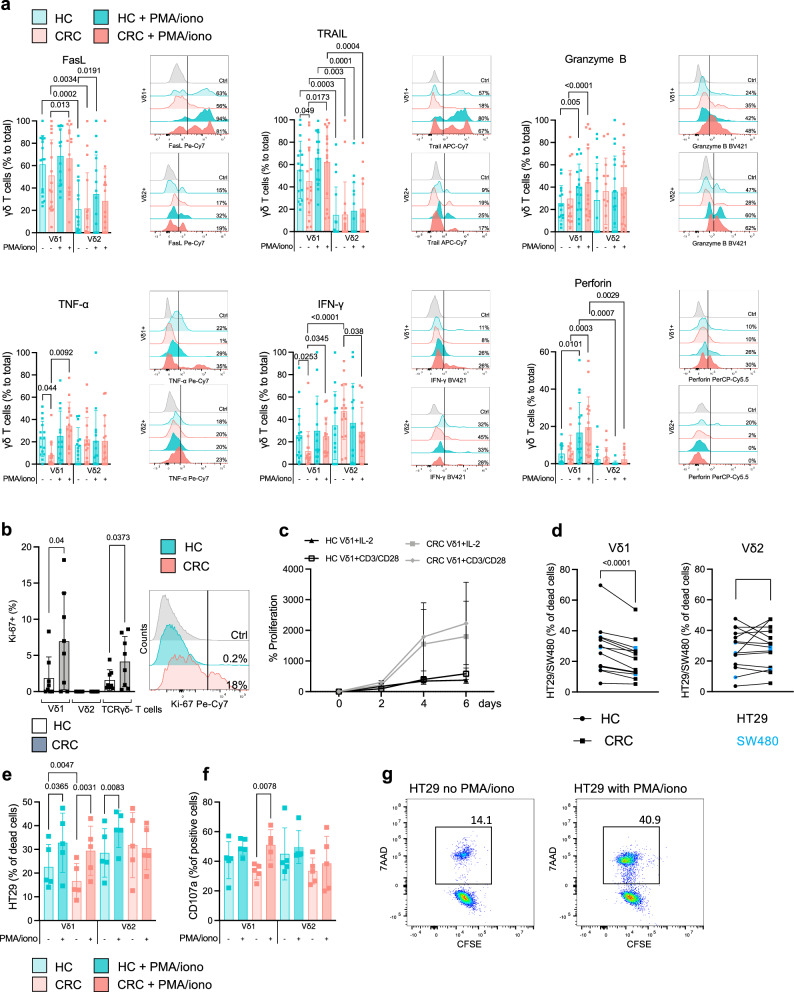
Fig. 4. Dysfunctional cytotoxic potential of Vδ1 + T cells from MSS CRC can be restored in vitro.
Flow cytometry analysis of intracellular cytokine staining of Vδ1 + and Vδ2 + T cells in HC or CRC. a Overlay of representative histograms and corresponding bar plots of tested cytokines by flow cytometric analysis in Vδ1 + and Vδ2 + T cells in HC (light cyan) or CRC (light pink) and stimulated (PMA/iono) HC (cyan) or CRC (pink, n = 16 per group). In CRC, Vδ1 + display reduced expression of TRAIL, TNF-α and IFN-γ which is reversible upon stimulation. b Percentage of Ki-67 + Vδ1 + , Vδ2 + and TCRγδ negative T cells in HC (white) compared to CRC (gray; n = 8 per group). Increased expression of Ki-67 in Vδ1 + and TCRγδ negative T cells in CRC indicate in tissue proliferation in contrast to the Ki-67 negative Vδ2 + T cells which potentially influx from the periphery. Overlay of representative histograms of Ki-67 expression in HC (cyan) and CRC (pink). c Increased Ki-67+ expression of Vδ1 + T cells isolated of CRC was mirrored in elevated proliferation (gray) during IL-2 alone or CD3/CD28 stimulation as compared to HC (white; n = 3 per group). d Pairwise comparison of killing assay with Vδ1 + and Vδ2 + T cells with two different CRC lines (HT29 in black, SW480 in blue; n = 14 per group). e Percentage of dead HT29 after exclusion of baseline HT29 cell death in a killing assay with Vδ1 + and Vδ2 + T cells isolated from HC (cyan) and CRC (pink). Two conditions were tested: Vδ1 + and Vδ2 + T cells with (cyan, pink) and without PMA/iono stimulation (light cyan, light pink; n = 5 per group). f CD107a expression of Vδ1 + and Vδ2 + T cells from HC (cyan) and CRC (pink) after killing of HT29 as in (e). g Representative FACS plot of dead HT29 in a killing assay with Vδ1 + T cells with no stimulation and stimulated with PMA/ionomycin. Data points and error bars represent the mean ± SD (a−f); one-way ANOVA with Fisher’s LSD (a−f); Ctrl; Control; p values are shown on the graphs.

