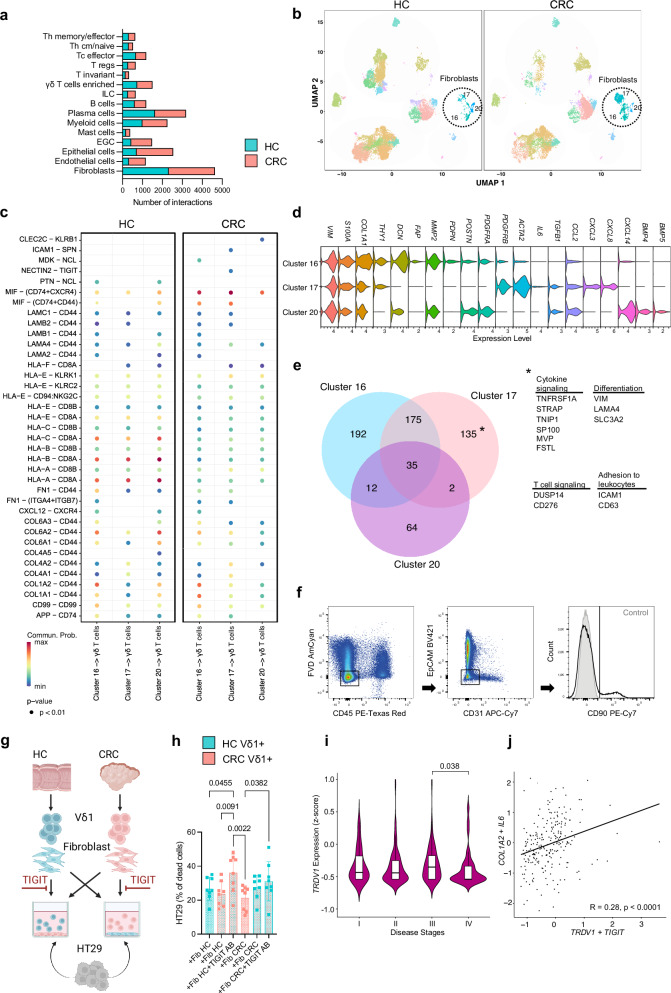
Fig. 5. Impaired killing capacity by Vδ1 + T cells can be reinstated after TIGIT blockade.
a Number of predicted overall interactions of depicted cell clusters in HC and CRC using CellChat. b UMAP of CD45+ and CD45– cells of HC and CRC displayed according to the similarity of their transcriptome. Fibroblasts clusters are highlighted. c Significant receptor-ligand interactions of fibroblasts cell clusters to γδ T cells as predicted by CellChat in HC and CRC. d Marker gene expression of fibroblast clusters. e Co-expression analysis of differentially overexpressed genes of each fibroblast cluster in CRC. f Gating strategy of fibroblast isolation for experiment as performed in (g). g Viable Vδ1 + T cells and fibroblasts were isolated from HC and CRC, fibroblasts were seeded, with or without antibody-blocking of TIGIT, Vδ1 + T cells were added and killing assay with HT29 was performed. h Percentage of dead HT29 after exclusion of baseline HT29 cell death in a killing assay as stated in (g); n = 8 per group. i TRDV1 expression of patients with disease stages I, II, III, IV in the MSS CRC cohort of the TCGA-COAD (n = 29 for I, n = 64 for II, n = 77 for III, n = 38 for IV). j Correlation between COL1A2, IL6 with TRDV1, TIGIT expressing cells in the MSS cohort of the TCGA-COAD. Data points and error bars represent the mean ± SD (h), Violin plots display median, quartiles ±SD (i); Wilcoxon Rank Sum test (c). one-way ANOVA with Fisher’s LSD (h), two-tailed paired t-test (i), Pearson Correlation (j). p values are shown on the graphs.

