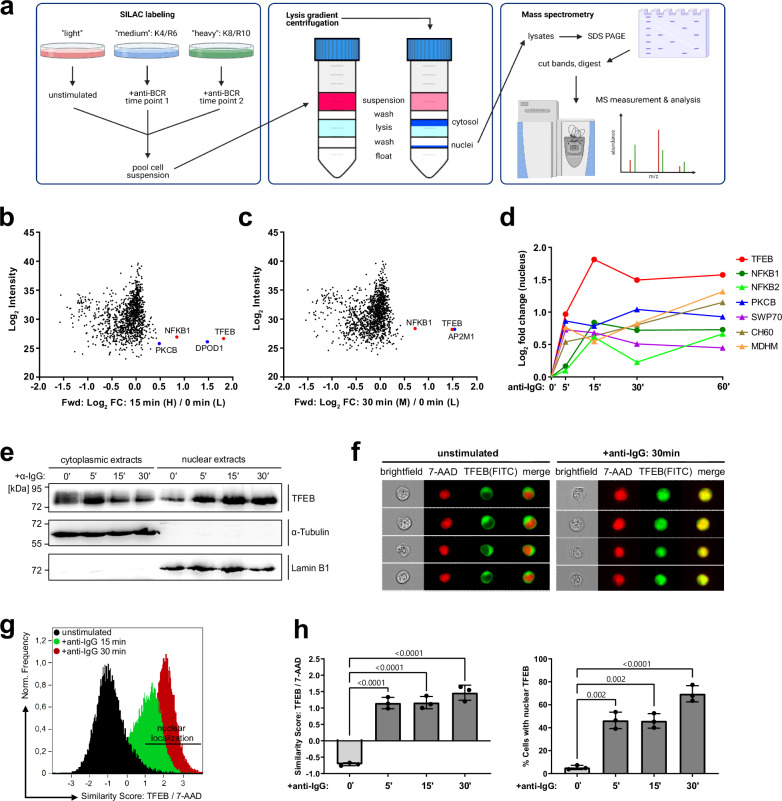
Fig. 1. Proteomic profiling of B-lymphoid nuclear logistics reveals TFEB as a BCR-inducible element.
a Schematic representation of the ‘translocatome’ approach. IIA1.6 B cells were metabolically labeled via SILAC using three distinct combinations of isotope-marked lysine (K) and arginine (R), and either left untreated or BCR-stimulated for multiple time points (left). Pooled cells were fractionated by iodixanol-based lysis gradient centrifugation (middle). Nuclei were lysed and nuclear proteins were quantified by LC/LC tandem mass spectrometry (right). This graphical overview was created with BioRender.com under a Creative Commons Attribution-NonCommercial-NoDerivs 4.0 international license. a–c Triple SILAC MS analysis of BCR-induced nuclear translocation. b, c Scatter plots representing log2-fold enriched nuclear proteins following 15 and 30 min of BCR stimulation plotted against the log2 signal intensity. Proteins significantly enriched at two-time points are highlighted in blue, and significantly enriched proteins at ≥ 3-time points are marked in red. d Nuclear translocation kinetics of significantly enriched proteins detected at all indicated time points of BCR stimulation. Circles and triangles indicate proteins identified under ‘forward’ or ‘reverse’ SILAC labeling conditions. e IIA1.6 B cells were left untreated or BCR-stimulated for the indicated time periods, fractionated via iodixanol-based lysis gradient centrifugation and the subcellular distribution of TFEB was analyzed by immunoblotting with anti-TFEB antibodies. Successful subcellular fractionation was confirmed by immunoblotting with antibodies against tubulin and lamin B1 as cytosolic and nuclear envelope marker proteins, respectively. Relative molecular masses of marker proteins are indicated on the left in kDa. f–h Resting or BCR-stimulated IIA1.6 B cells were fixed and stained with rabbit anti-TFEB and anti-rabbit-FITC antibodies. Nuclei were counterstained with 7-AAD. Nuclear translocation kinetics of TFEB was assessed by imaging flow cytometric analysis of 2 × 10⁴ cells and is shown in (f) as representative images depicting untreated versus BCR-stimulated cells, in (g) as histograms depicting the similarity co-localization scores of TFEB (FITC) versus 7-AAD in (h) as mean similarity score of TFEB/7-AAD and as defined by the percentage of cells with similarity score of TFEB/7-AAD ≥ 1. Data is depicted as mean ± SD of n = 3 independent experiments. Statistical significances were calculated using one-way ANOVA and corrected for multiple testing via Tukey’s method. Source data are provided as a Source Data file.

