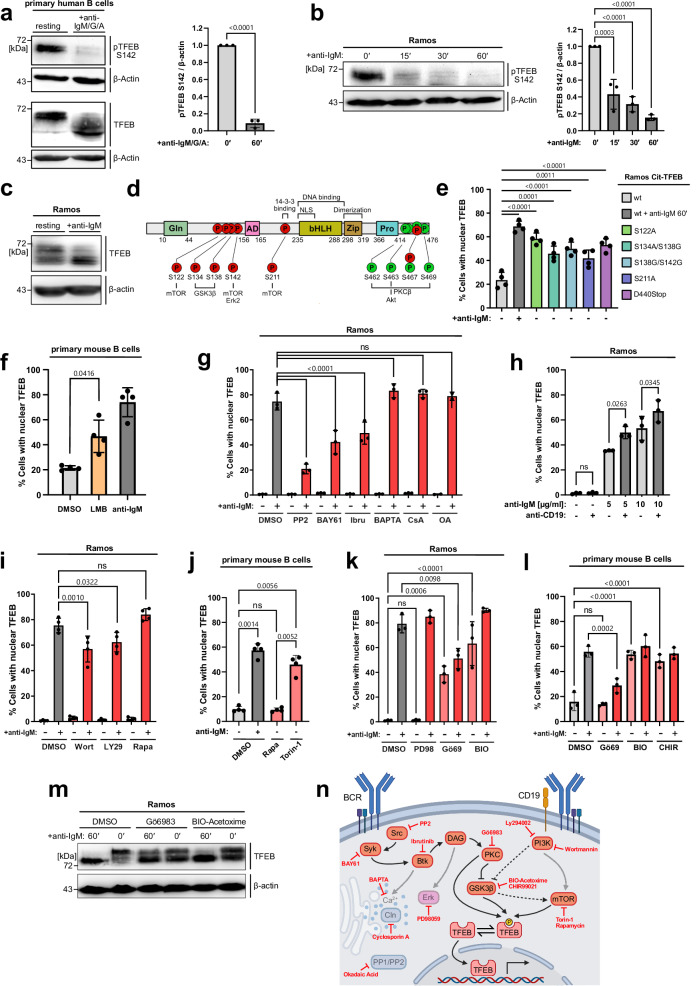
Fig. 4. BCR signaling mobilizes TFEB through kinase inhibition.
a–c Resting or BCR-stimulated primary human B cells from the blood of healthy donors (a) or Ramos B cells (b, c) were subjected to immunoblot analysis of total TFEB and phospho-S142 TFEB. Quantification of phospho-S142 TFEB in (a, b) was normalized to β-actin and is depicted as mean ± SD of n = 3 independent experiments. Statistical significance was computed using (a) an unpaired two-tailed Student’s t-test or (b) Tukey-corrected one-way ANOVA. d Schematic representation of reported TFEB phosphorylation sites (P) within individual TFEB domains indicated by GLN (glutamin-rich), AD (transcriptional activation), bHLH (basic helix-loop helix), Zip (leucine zipper), Pro, (proline-rich) and NLS (nuclear localization site). e Ramos transductants expressing TFEB variants were left untreated (−) or BCR-stimulated (+), and TFEB translocation was analyzed by imaging flow cytometry as described before. f CD19+ B cells of age-matched C57BL/6 mice were treated with DMSO, incubated with 20 nM leptomycin B (LMB) or BCR-stimulated for 60 min. g Wild-type Ramos B cells were left untreated (−) or BCR-activated (+, 60 min) in the presence of the following pharmacological agents: PP2, BAY61-3606 or ibrutinib (inhibiting Src, Syk or Btk, respectively), or the Ca2+ chelator BAPTA-AM, or cyclosporin A (calcineurin inhbitor) or okadaic acid (inhibitor of PP1 and PP2) and analyzed for TFEB translocation. h Wild-type Ramos B cells were treated with anti-BCR antibodies or 10 µg/ml anti-CD19 antibodies as indicated. i–l Nuclear translocation of TFEB in wild-type Ramos (i and k) or CD19+ splenic B cells of age-matched C57BL/6 mice (j and l) were left untreated (−) or BCR-activated (+, 60 min) in the presence of the following pharmacological inhibitors: Wortmannin, LY294002 (both PI3K), rapamycin (mTOR), torin-1 (ATP-competitive mTOR inhibitor), PD98059 (ERK), BIO-Acetoxime (GSK3β), CHIR99021 (GSK3β) or Gö6983 (PKC). Data is depicted as mean ± SD of n = 3 (g, h, k and l) or n = 4 (e, f, i and j) independent experiments. Statistical significances were computed using Tukey-corrected one-way ANOVA. m Immunoblot analysis of TFEB phosphorylation in Ramos B cells left untreated or BCR-activated in the presence of the indicated kinase inhibitors. n Schematic representation of the examined signaling network. This graphical overview was created with BioRender.com under a Creative Commons Attribution-NonCommercial-NoDerivs 4.0 international license. Source data are provided as a Source Data file.

