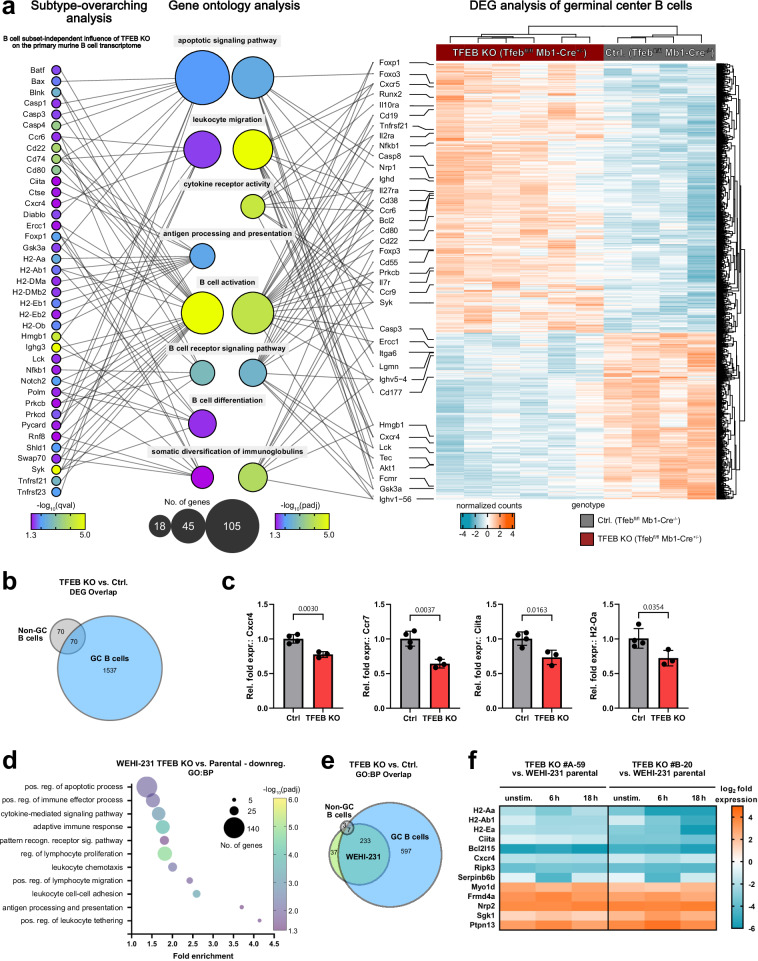
Fig. 5. TFEB shapes the transcriptional landscape of GC B cells.
a–e Splenocytes from TFEB-deficient C57BL/6 mice (n = 6) and control littermates (n = 4) were sorted into B220+Fas+GL7+ germinal center (GC) and B220+Fas-GL7- non-GC B cells and subjected to bulk RNA sequencing. a B cell subtype-overarching analysis shows the transcriptional deregulation explained by TFEB’s absence across non-GC and GC subsets. DEGs were defined by a qval< 0.05, with selected DEGs shown on the left. Statistical significances were computed using likelihood-ratio tests, corrected for multiple testing via Benjamini & Hochberg’s method. The heatmap on the right shows all > 1600 DEGs (padj< 0.05) in TFEB-negative GC B cells and their clustering among genotypes and samples. Statistical significances were computed using Wald tests, adjusted by Benjamini & Hochberg’s procedure. Selected DEGs found in either analysis were mapped onto relevant “biological process” GO terms (GO:BP, middle). GO enrichment and the number of DEGs per term are reflected in the respective bubble’s color and size. Selected target genes are connected via line to their respective GO terms. b Venn diagram of DEGs between TFEB-deficient GC and non-GC B cells. c FACS-sorted non-GC B cells from TFEB KO (n = 4) and control littermates (n = 3) were subjected to qRT-PCR analysis. Normalized expression of selected genes is depicted as mean ± SD. Statistical significances were computed using unpaired two-sided Student’s t-tests. d–f Independent TFEB-deficient WEHI-231 clones (#A-59 and #B-20) and parental cells were left untreated or BCR-stimulated for 6 or 18 h and subjected to RNA sequencing. Data were derived from n = 2 independent experiments using two mutant clones. DEGs were defined by an FDR < 0.01 and a log2 fold change of > 1 or < −1 and were subjected to gene ontology analysis (‘GOrilla’). d Selection of highly enriched GO terms. The number of genes per term is illustrated by bubble size, while adjusted FDR values are represented through a color gradient. e Venn diagram of significantly enriched GO:BP terms between TFEB-depleted GC B cells, non-GC B cells and WEHI-231 knockouts. f Heatmap depicting log2 fold changes of selected DEGs with immunological relevance for TFEB mutant clones versus parental WEHI-231 cells. Source data are provided as a Source Data file.

