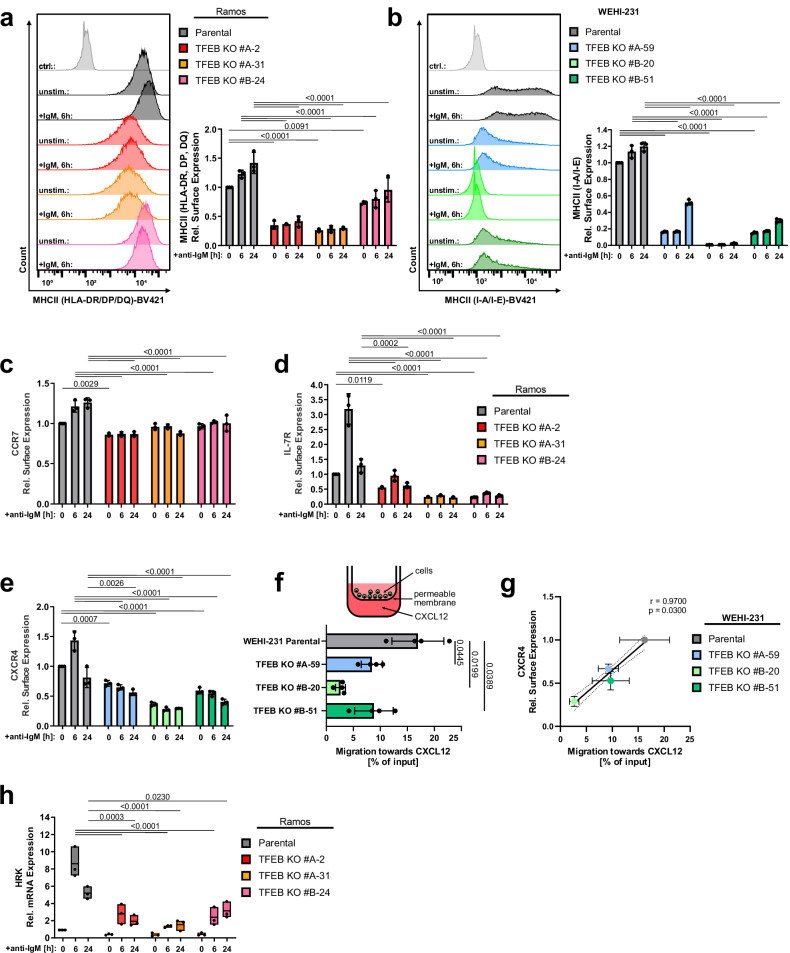
Fig. 6. TFEB governs B cell responsiveness to co-stimulatory signals.
Wild-type or three independently generated TFEB mutants of either Ramos (a, c, and h) or WEHI-231 cells (b and e) were left untreated or BCR-stimulated for the indicated time periods. Subsequently, cell surface expression of MHC class II proteins (a, b), the cytokine receptors CCR7 (c), IL-7 R (d) and CXCR4 (e) was analyzed by flow cytometry. f The migratory capability of wild-type or TFEB mutant WEHI-231 cells towards CXCL12 was measured through transwell migration assays. Data in (a–f) are presented as mean ± SD of n = 4 independent experiments. Statistical significances were computed using one-way ANOVA and corrected for multiple testing via Dunnett’s method. g The amount of surface CXCR4 expression measured in (e) was plotted against the migration efficiency towards CXCL12 depicted in (f). The linear relationship between these parameters was analyzed using Pearson’s correlation. Statistical significance is depicted as correlation coefficient and the corresponding two-sided p value. Linear regression is shown as solid line and the 95% CI is marked with dotted curves. h HRK relative mRNA expression was quantified by qRT-PCR using the ΔΔCT-method. Data is presented as mean of n = 3 independent experiments (with the box depicting min, max and the mean values). Source data are provided as a Source Data file.

