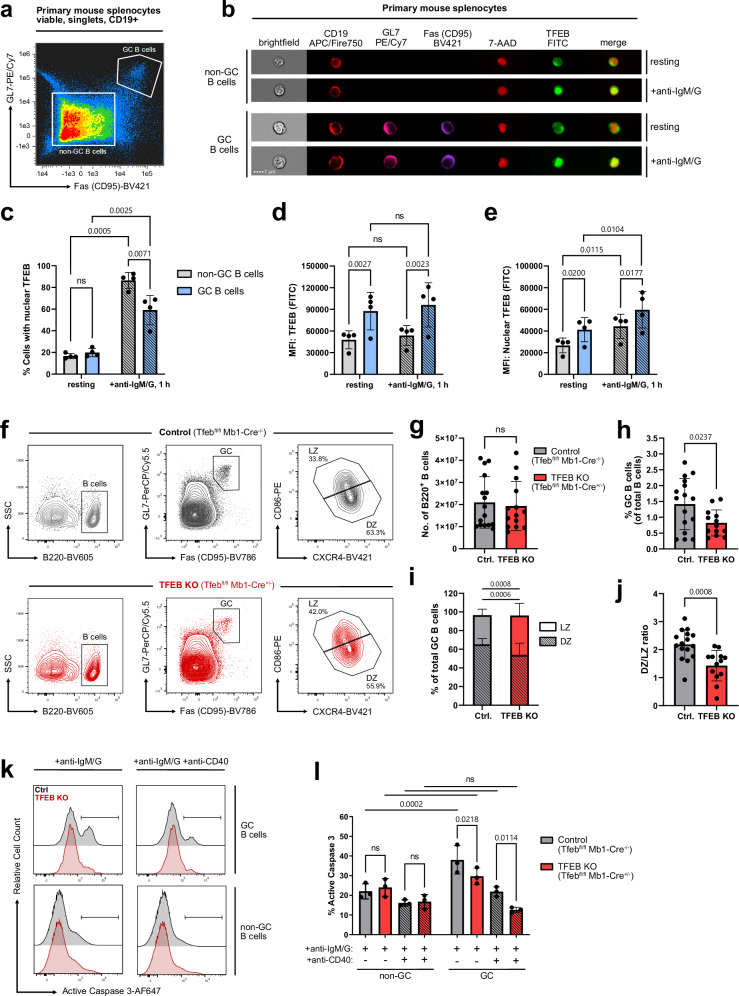
Fig. 8. TFEB promotes antigen-induced apoptosis in GC B cells.
a–e Mouse splenocytes were left untreated or stimulated with anti-IgM/G for 60 min and analyzed for TFEB expression and subcellular distribution by imaging flow cytometry. a Staining strategy to distinguish germinal center and non-GC B cells from total splenocytes. GC B cells were gated as CD19+Fas+GL7+, whereas non-GC B cells were defined as CD19+Fas-GL7- (gating depicted in Supplementary Fig. 9a). b Representative multi-channel images of individual resting and BCR-stimulated germinal center and non-GC B cells. c Percentage of cells with translocated TFEB, as defined by TFEB/7-AAD similarity score ≥ 1. d Mean fluorescence intensity of TFEB. e Mean fluorescence intensity of TFEB within the nucleus. Data are depicted as mean ± SD of n = 4 littermates. Statistical significances were computed using RM two-way ANOVA, corrected for multiple testing via Tukey’s method. f–j Flow cytometric analyzes of GC subsets in B cell-conditional TFEB mutant mice (n = 13) and control littermates (n = 16). f GC B cells gated as B220+Fas+GL7+. were further distinguished in LZ and DZ GC B cells by their expression of CD86 and CXCR4. g Absolute number of splenic B220+ B cells. h Percentage of B220+Fas+GL7+ GC B cells among total B220+ B cells. i Percentage of LZ and DZ GC B cells among total GC B cells. j Ratio of LZ and DZ GC B cells. Data in (g–j) are depicted as mean ± SD. Statistical significances were computed using Šidák-corrected RM two-way ANOVA (i) or two-tailed Student’s t-test (g–j). k, l Splenocytes of TFEB-depleted and control mice were isolated and stimulated with anti-IgM/G and co-stimulated with CD40 for 18 h, as indicated. CD19+ B cells were further subgated into germinal center (CD19+Fas+GL7+) and non-GC B cells (CD19+Fas-GL7-; gating depicted in Supplementary Fig. 9b) and co-stained with anti-active caspase-3-AF647 and Zombie Green dye. k Selected histograms depicting active caspase-3 fluorescence intensity. l Proportions of active caspase-3-positive B cells among GC or non-GC B cells, depicted as mean ± SD of n = 3 independent experiments. Statistical significances were computed using RM two-way ANOVA and Fisher’s LSD test. Source data are provided as a Source Data file.

