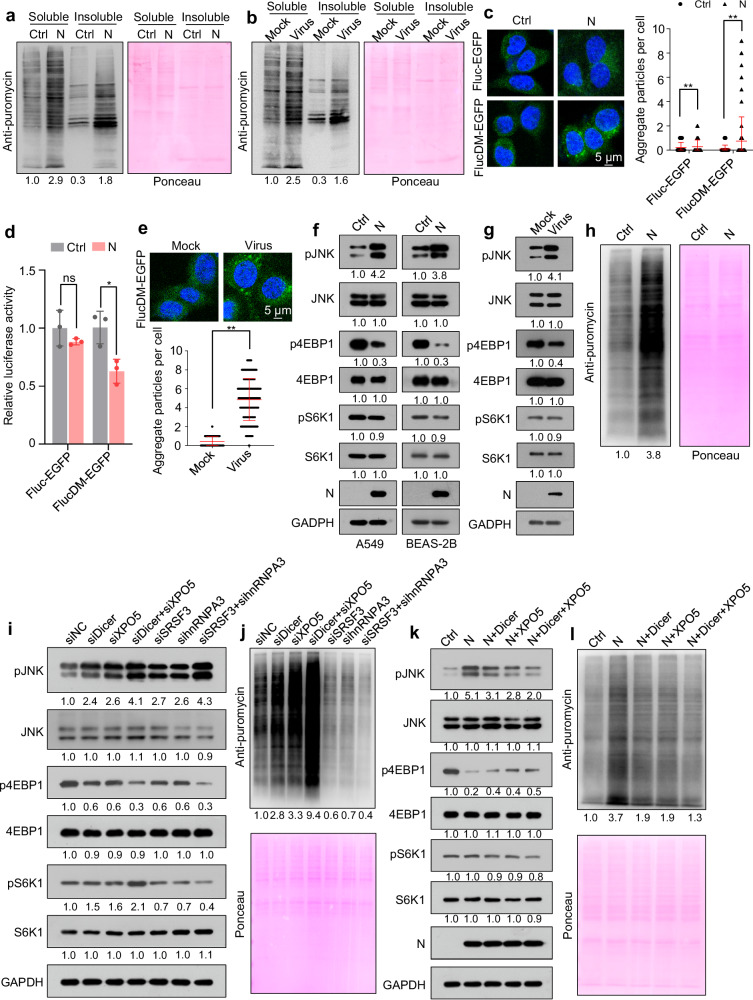
Fig. 6. SARS-CoV-2 N protein induces proteotoxic stress and increases protein translation.
See also Supplementary Fig. 6. Immunoblotting of nascent polypeptides labeled with puromycin in the soluble and insoluble extracts of A549-Ctrl and A549-N cells (a) and SARS-CoV-2- or mock-infected A549-hACE2 cells (b). A549-Ctrl or A549-N cells transfected with proteotoxic stress sensor reporters encoding Fluc-EGFP or FlucDM-EGFP and analyzed using confocal microscopy (c, n = 200 cells from three biological replicates) or a luciferase assay (d, n = 3 biological replicates). e A549-hACE2 cells transfected with proteotoxic stress sensor reporter FlucDM-EGFP were infected with SARS-CoV-2 and analyzed using confocal microscopy (n = 200 cells from three biological replicates). f Immunoblotting of the indicated proteins in A549-Ctrl and A549-N (left) or BEAS-2B-Ctrl and BEAS-2B-N (right) cells. g Immunoblotting of the indicated proteins in A549-hACE2 cells infected with SARS-CoV-2 or mock. h Immunoblotting of nascent polypeptides labeled with puromycin in A549-Ctrl and A549-N cells. i, j Immunoblotting of the indicated proteins (i) or nascent polypeptides labeled with puromycin (j) in A549 cells transfected with different siRNAs. k, l Immunoblotting of the indicated proteins (k) or nascent polypeptides labeled with puromycin (l) in A549-Ctrl, A549-N, and A549-N cells transfected with Dicer-expressing plasmid, XPO5-expressing plasmid, or both. Ponceau S staining image represents the loading control in (a, b, h, j, l). The numbers below the blots indicate the relative densitometric quantification of the bands normalized to corresponding GAPDH bands (f, g, i, k) or Ponceau S staining bands (a, b, h, j, l); the mean values of three independent experiments are shown. Data in (c–e) are expressed as mean ± SD. **p < 0.01; *p < 0.05; ns not significant (p > 0.05; two-tailed unpaired Student’s t-test). Ctrl control plasmid, N N protein, siNC negative control siRNA. Source data and exact p values are provided in the Source Data file.

