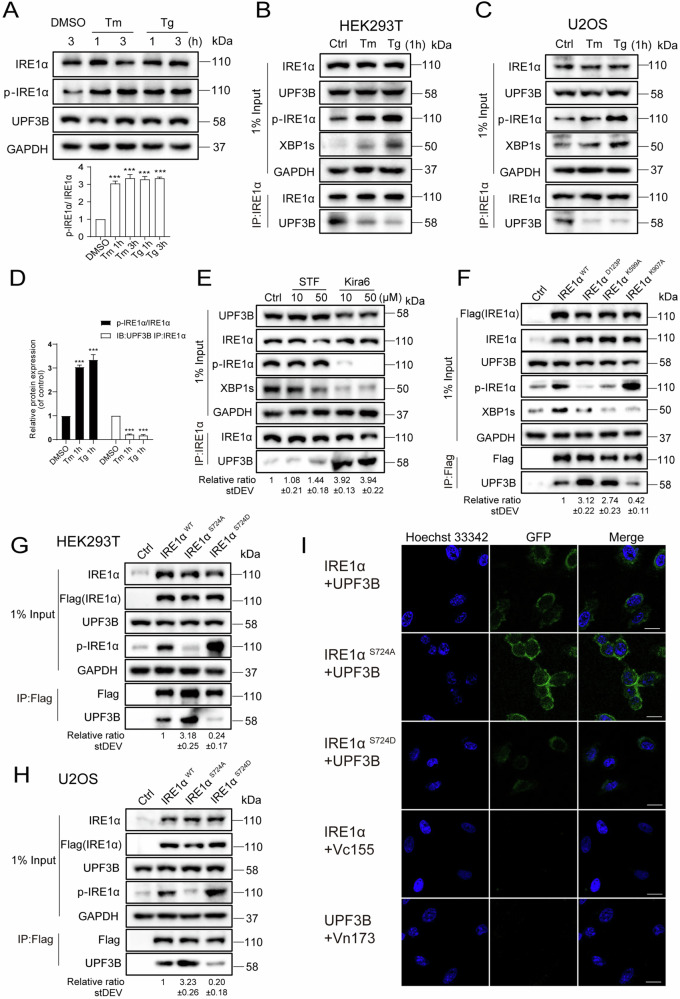
Fig. 4. Phosphorylation of IRE1α inhibits its interaction with UPF3B.
A The levels of phosphorylated IRE1α were evaluated following treatment with dimethyl sulfoxide (DMSO), Tg (2 μM), or Tm (10 μg/mL) for 1 or 3 h. All the target protein levels were analyzed by western blotting and quantification (n = 3). B–D Immunoprecipitation analysis of the endogenous interaction between IRE1α and UPF3B under ER stress in indicated cell lines, HEK293T and U2OS. Cells were incubated with Tg and Tm for 1 h, and then subjected to western blotting analysis and quantification (n = 3). The results are the means ± SEMs of at three independent experiments. Statistical significance was defined as *p < 0.05, **p < 0.01 or ***p < 0.001. E The effect of kinase and endonuclease activity of IRE1α on the interaction between IRE1α and UPF3B. Cells were incubated with STF and Kira6 (10 or 50 μM) for 6 h. The cell lysates were subjected to immunoprecipitation with the indicated antibodies, and visualized by western blotting. The data statistics of the interaction between IRE1α and UPF3B was showed in Fig. S9. F Co-IP analysis of the interaction between IRE1α mutants and UPF3B. HEK293T cells were transfected with the Flag tagged IRE1α mutants for 24 h. The cell lysates were subjected to immunoprecipitation with the indicated antibodies, and visualized by western blotting. pCDNA3.1 transfection was used as a negative control. G–H Phosphorylation of IRE1α inhibit the interaction between IRE1α and UPF3B in HEK293T and U2OS cell lines. The indicated cell lines were transfected with IRE1αWT, the IRE1αS724 mutants for 24 h. The cells were then harvested and subjected to western blotting analysis. The data statistics of the interactions were showed in Fig. S9. I The co-localization of IRE1α with UPF3B was evaluated by BiFC. IRE1α-Vn173 and UPF3B-Vc155 constructs and the mutants were transfected into U2OS cells, then stained with Hoechst 33342. The figures show representative fluorescent images of the indicated proteins. Scale bar, 20 μm.

