Figure 1.
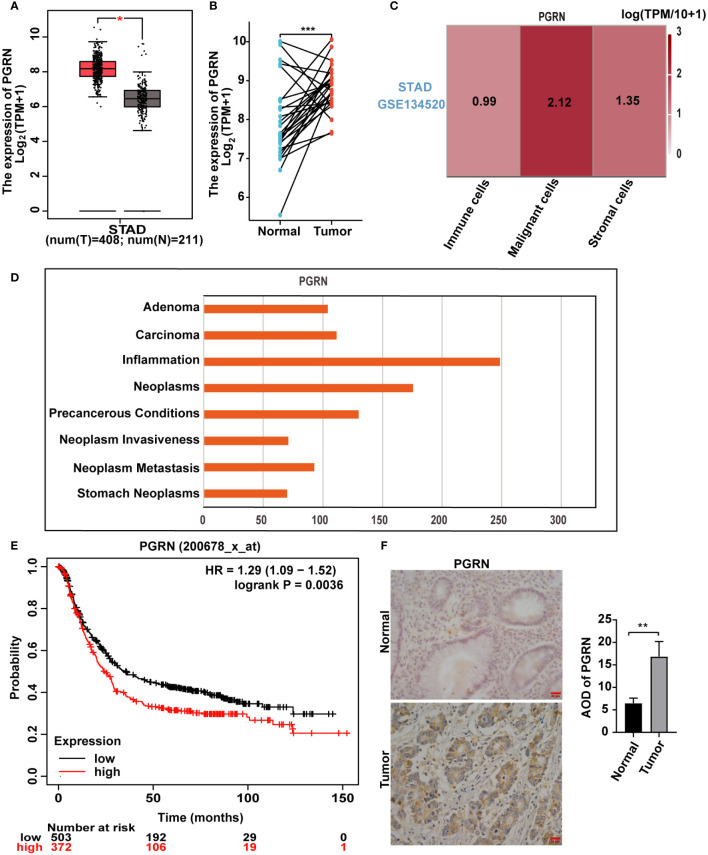
PGRN is up-regulated in GC and associated with poor prognosis. (A) Analysis of mRNA expression level of PGRN in GC tissues and non-tumor tissues according to TCGA database, with T representing GC tissue and N representing normal gastric mucosal epithelial tissue. (B) PGRN expression levels in GC and adjacent normal tissues across TCGA. The lines between the samples are one-to-one paired GC and para-cancerous tissue. (C) TISCH database analysis of PGRN expression in the microenvironment of GC (STAD-GSE134520). The number means the expression levels of PGRN in different cell types. (D) CTD database analysis of PGRN expression in malignant phenotype. (E) Kaplan-Meier analysis of overall survival (OS) in GC patients based on PGRN expression level. (F) Immunohistochemistry staining of PGRN in human adjacent normal and GC tissues. Scale bars, 20 μm. (*P<0.05, **P<0.01, ***P<0.001).

