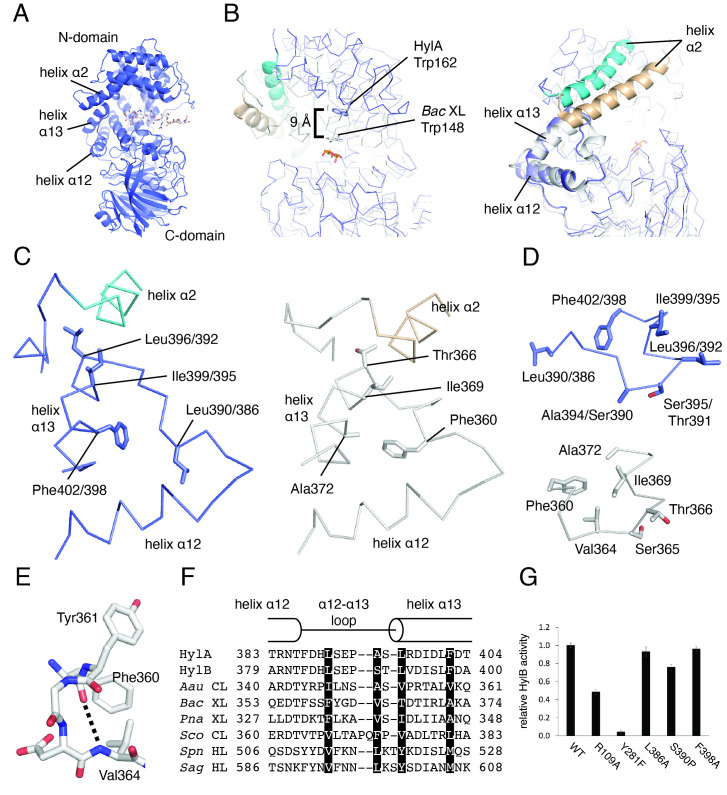
Figure 1. Structural features of helix α2, helix α13, and the α12-α13 loop .
A) Structure of HylA (PDB 8FYG) (Hajam et al., 2023) with hexasaccharide hyaluronan (white) modeled in catalytic cleft based on overlay of HylA with S. agalactiae hyaluronate lyase in complex with hyaluronan (PDB 1LXM) (Mello et al., 2002). B) Overlay of HylA and Bac XL in complex with mannose (PDB 2E22) (Maruyama et al., 2007), aligned on their C-domains. HylA is colored blue; Bac XL is white. Helix α2 is colored cyan and tan for HylA and Bac XL, respectively. Mannose is colored orange. C) Helix α2, α12-α13 loop, and helix α13 of HylA (left panel) and Bac XL (right panel). Residue numbers on left panel correspond to those for HylA followed by HylB. D) The α12-α13 loop of HylA (top panel) and Bac XL (bottom panel). Residue numbers on top panel correspond to those for HylA followed by HylB. E) Helical interaction within the α12-α13 loop of Bac XL. Dotted line represents a hydrogen bond that forms an α-helical interaction. F) Sequence alignment of helix α12, α12-α13 loop, and helix α13 of structurally known gram-positive GAG lyases. Sequences were aligned according to crystal structures. Key residues of proposed opening/closing mechanism are highlighted. Aau CL, A. aurescens chondroitin AC lyase; Bac XL, Bacillus sp. strain GL1 xanthan lyase; Pna XL, P. nanensis xanthan lyase; Sco CL, S. coelicolor chondroitin AC lyase; Spn HL, S. pneumoniae hyaluronate lyase; Sag HL, S. agalactiae hyaluronate lyase. G) Hyaluronate lyase activity of HylB and mutants. HylB at concentration 15 ng/mL and high molecular weight hyaluronic acid at concentration 0.2 mg/mL were monitored at wavelength 232 nm. Reaction volume was 100 μL. Assay buffer contained 100 mM Na acetate pH 5.5, 10 mM CaCl 2 , and 0.5 mM TCEP. Results are scaled relative to wild-type HylB. Error bars are standard error of three measurements.

