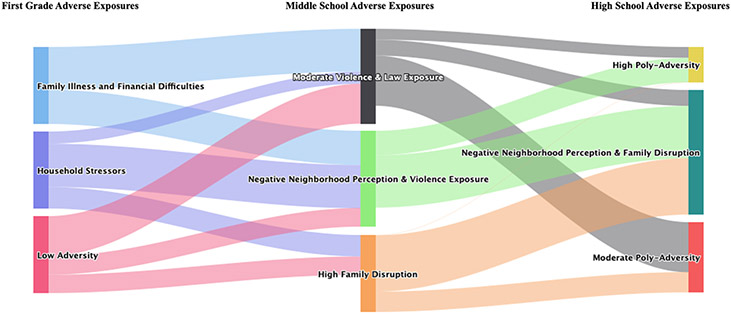
Figure 4. Sankey Diagram Reflecting Transition Probabilities from Adjusted RI-LTA Model.
Note. Left of figure: first grade adversity classes, middle of figure: middle school adversity classes, right of figure: high school adversity classes; RI-LTA model was adjusted for child race, gender, free/reduced lunch status and intervention status (~33% control, ~33% classroom-based, ~33% family-school partnership); thicker lines indicate higher transition probability.

