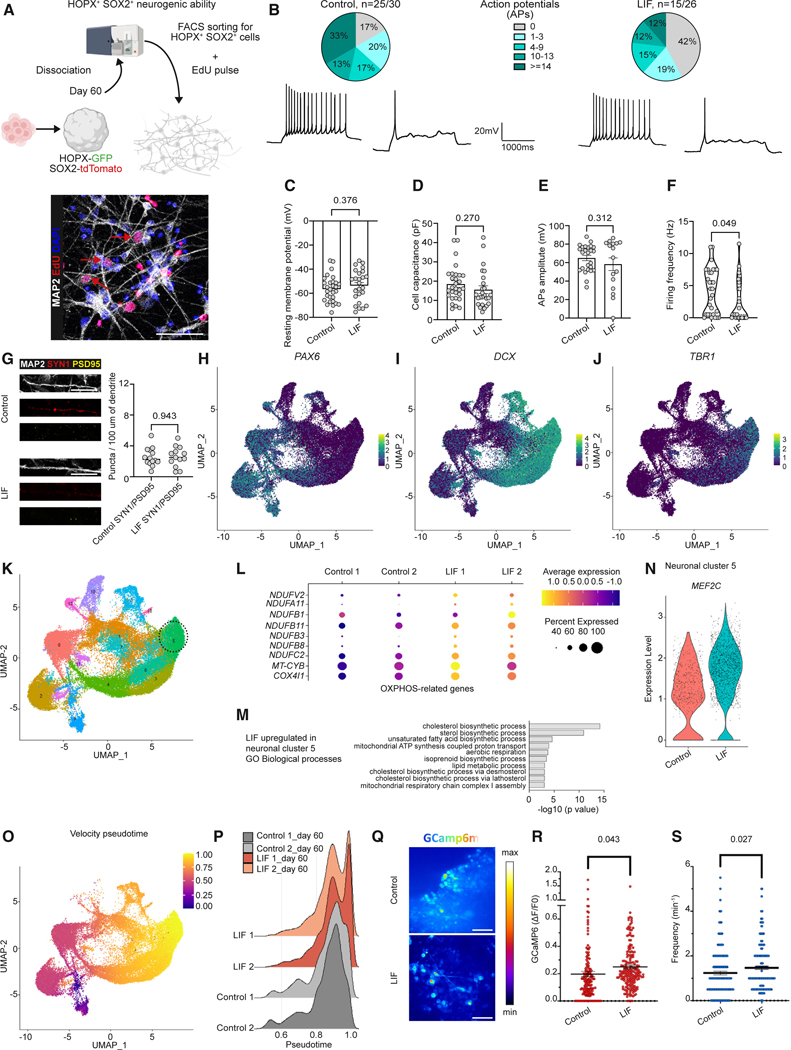
Figure 3. Neurogenic competence of LIF-induced oRG.
(A) FACS sorting strategy to isolate SOX2+ HOPX+ progenitor cells from LIF-treated brain organoids and test their neurogenic differentiation potential in a monolayer culture. MAP2 (gray) and EdU (red) staining on dissociated monolayers from LIF-treated organoids. Nuclei are stained with DAPI in blue. Scale bar, 50 μm.
(B–F) Manual patch-clamp results for the total number of recorded action potentials (APs) on dissociated monolayers from control and LIF-treated brain organoids (B). Patch-clamp results for the resting membrane potential (C), cell capacitance (D), AP amplitude (E), and firing frequency (F); Welch’s t test.
(G) MAP2 (gray), SYN1 (red), and PSD95 (yellow) staining and quantifications of monolayer cultures derived upon dissociation of control and LIF-treated brain organoids. Welch’s t test. Scale bars, 25 μm.
(H–J) Feature plots depicting the distribution of the expression of PAX6 (H), DCX (I), and TBR1 (J) in control and LIF-treated organoids at day 60.
(K) Seurat clusters in control and LIF-treated organoids at day 60. The neuronal cluster 5 is highlighted.
(L) OXPHOS-related genes enriched in cluster 5 at day 60.
(M) GO Biological Process terms involved in metabolism enriched in cluster 5 and upregulated in LIF-treated organoids.
(N) Violin plot showing expression levels of MEF2C in control and LIF-treated organoids at day 60 in the neuronal cell cluster 5.
(O) Velocity pseudotime plots showing all neural cells undergoing maturation.
(P) Ridge plots showing expression levels of neural cells that undergo maturation in LIF-treated organoids compared to control organoids at day 60.
(Q–S) Calcium imaging (Q) and analysis showing quantification of Ca2+ intensity (Welch’s t test) (R) and frequency (Welch’s t test) (S) measured in control and LIF-treated organoids at day 60. Scale bars, 50 μm.

