
Figure 4. Pericytes secrete LIF and promote oRG emergence.
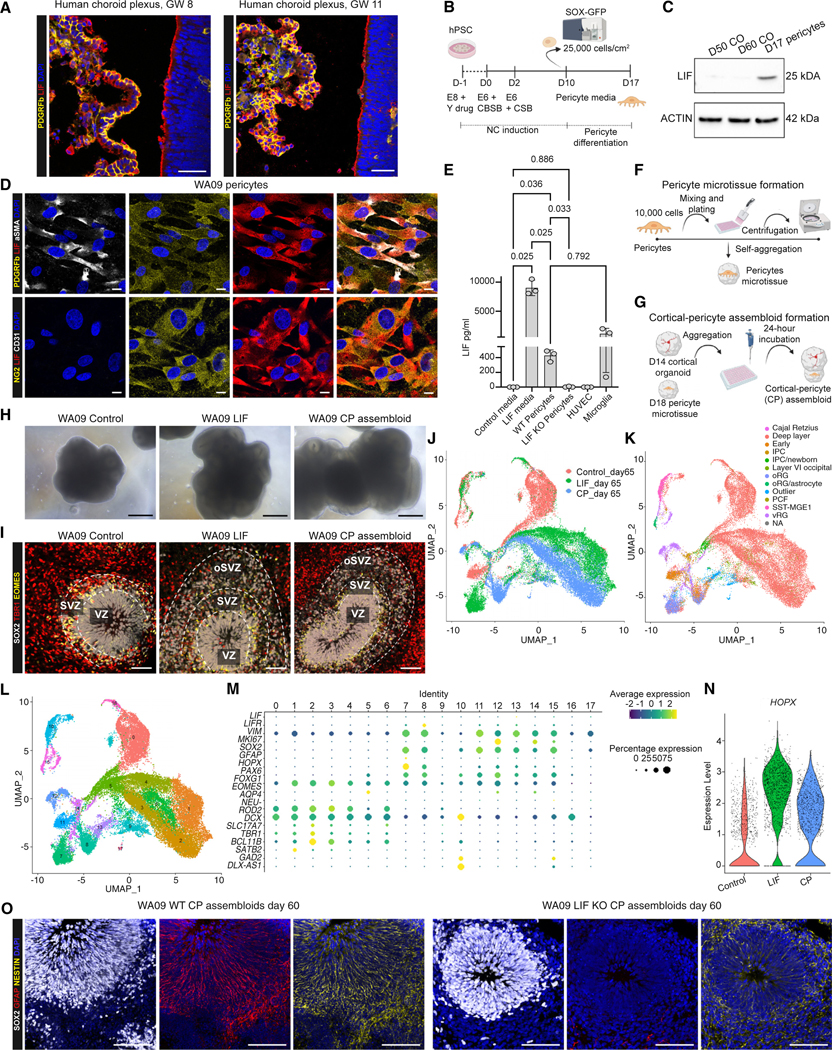
(A) PDGFRβ (yellow) and LIF (red) staining in human fetal choroid plexus at gestational week (GW) 8 and 11. Nuclei are stained in blue with Hoechst. Scale bars, 50 μm.
(B) Schematic representation of the pericyte differentiation protocol from WA09-SOX10-GFP hPSC-derived neural crest (NC) cells. CBSB corresponds to CHIR (600 nM), BMP4 (1 ng/mL), and SB (10 μM). CSB corresponds to CHIR (1.5 μM) and SB (10 μM). On day 10, hPSC-derived NC cells were sorted based on GFP expression to derive SOX10+ NC cells. SOX10+ cells were maintained in pericyte medium to generate NC-derived pericytes.
(C) Western blot data showing LIF expression in day 17 NC-derived pericytes but not in control cortical organoids (COs) at day 50 and 60 of differentiation.
(D) Immunofluorescence images of day 17 NC-derived pericytes for pericyte markers PDGFRβ (yellow), NG2 (yellow), and αSMA (white), endothelial marker CD31 (white), and LIF (red). Cell nuclei are shown by DAPI. Scale bars, 10 μm.
(E) ELISA assay for LIF in control NC-derived pericytes, LIF KO NC-derived pericytes, HUVEC cells, and hPSC-derived microglia. Positive and negative controls are cortical organoid media with or without LIF addition, one-way ANOVA with Tukey’s test.
(F and G) Schematic outline showing the protocol to form pericyte microtissues (F) and cortical-pericyte (CP) assembloids (G).
(H) Representative bright-field images of the morphological appearance of WA09 control organoids, LIF-treated organoids, and CP assembloids at day 60. Scale bars, 100 μm.
(I) SOX2 (gray), TBR1 (red), and EOMES (green) staining showing rosette areas in control, LIF-treated organoids, and CP assembloids. Cell nuclei are stained by DAPI and shown in blue. Scale bars, 100 μm.
(J–L) scRNA-seq experiments showing plots for original identity (J), label transfer, cell type annotation, and data integration with in vivo dataset from Bhaduri et al.24 (K), and Seurat clusters (L) in control organoids, LIF-treated organoids, and CP assembloids at day 65.
(M) Genes selected from (J) to mark selected populations of interest (dividing cells, neuronal cell types, and neuronal progenitors, astrocytes, postmitotic neurons, and radial glia) in control organoids, LIF-treated organoids, and CP assembloids at day 65.
(N) Violin plots showing expression levels of HOPX in control organoids, LIF-treated organoids, and CP assembloids at day 65.
(O) SOX2 (gray), GFAP (red), and NESTIN (yellow) staining in day 60 WT CP assembloids and LIF KO CP assembloids. Cell nuclei were stained by DAPI. Scale bars, 100 μm.