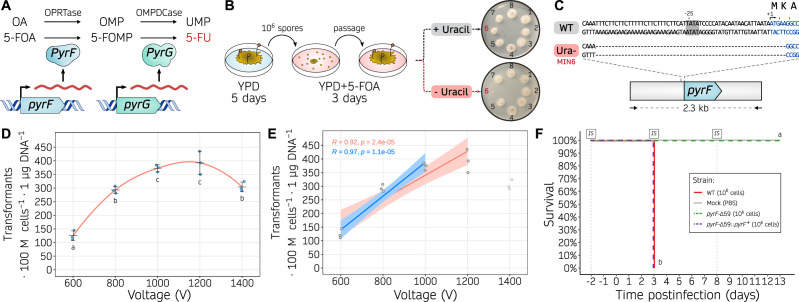
Fig 1.
Uracil auxotrophy enables M. circinelloides transformation based on a pyrF selectable marker. (A) Role of PyrF (orotate phosphoribosyltransferase, OPRTase) and PyrG (orotidine monophosphate decarboxylase, OMPDCase) in the uracil biosynthetic pathway, converting orotic acid (OA) to orotidine monophosphate (OMP), and OMP into uridine monophosphate (UMP), respectively. Alternatively, the same enzymes catalyze the conversion of 5-fluoroorotic acid (5-FOA) into fluoro-OMP (FOMP), and FOMP into 5-fluorouracil (5-FU), respectively. (B) Experimental design followed to isolate uracil auxotrophic strains. Briefly, wild-type spores were collected from YPD medium, counted, and one million spores were plated onto YPD containing 5-FOA. After 3 days, 5-FOA resistant colonies were isolated and transferred to new 5-FOA containing medium to confirm the resistance and then inoculated onto minimal medium either with or without uracil to confirm the auxotrophy. (C) pyrF sequences from the wild-type (WT) and uracil auxotrophic (Ura-, MIN6) strains, focusing on the 5′-region of the gene. The TATA box motif (gray background around position −25), transcription start site (arrow, position +1), pyrF coding sequence (blue font), and encoded one-letter amino acids are shown. (D, E) Transformation efficiency is measured as transformants per 100 million protoplasts per microgram of DNA using different voltages in the electroporation procedure. Individual values (dots) from biological triplicates were used to determine the mean and SD values as black lines. In (D), a smoothed curve is drawn as a red line. Significant differences among voltages were determined by a one-way ANOVA and Tukey HSD test, and voltages showing different letters indicate significant differences (P-value ≤ 0.05). In (E), two linear regression models are displayed showing a positive correlation for voltages from 600 to 1,000 V (blue line) or to 1,200 V (red line). Pearson’s correlation coefficients (R) are shown for each regression. (F) Kaplan-Meier survival curves of immunosuppressed mice after infection with M. circinelloides wildtype and transformable strains (color-coded). Intraperitoneal immunosuppressive (IS) treatments are shown. Strains showing significant differences in virulence are indicated as different letters (P-value ≤ 0.0001), assessed by a Log-rank test.

