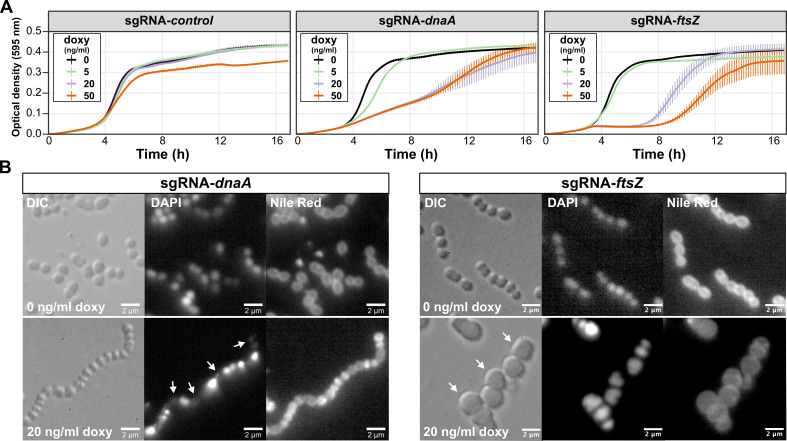
Fig 4.
Targeted repression of dnaA and ftsZ gene expression by CRISPRi in GAS. (A) Strains NV26 (NV6 + pDC-sgRNA-control), NV22 (NV6 + pDC-sgRNA-dnaA), and NV19 (NV6 + pDC-sgRNA-ftsZ) were grown in THB containing 2 µg/mL of chloramphenicol at 37°C. Exponentially growing cells were diluted to a start OD of 0.004 in a microtiter plate containing fresh THB with varying concentrations of doxycycline (doxy). The optical density at 595 nm was measured every 10 min. Each line is an average of three replicates with the standard deviation shown. For clarity, the optical density is plotted on a linear scale. (B) Strains NV22 and NV19 were grown in the presence or absence of 20 ng/mL of doxy, and after 3 h, cells were imaged by fluorescence microscopy. DAPI was used to stain the nucleoids and Nile red to stain the membrane. Scale bar: 2 µm. Arrows point to anucleate cells (sgRNA-dnaA) or cells with a block in division (sgRNA-ftsZ).

