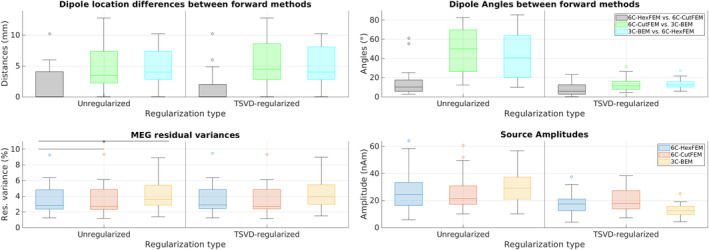
FIGURE 3.

Top row: Pairwise comparison of M20 dipole scan reconstruction location (mm) and orientation (°). In black is the difference between 6C‐HexFEM and 6C‐CutFEM reconstructions, green is 6C‐CutFEM versus 3C‐BEM, and blue is 3C‐BEM versus 6C‐HexFEM. Bottom row: Residual variance (%) and source amplitudes (nAm) of the M20 reconstruction using lead field matrices from different forward models. Asterisk marks significant differences (statistical comparisons were calculated for residual variance in unregularized dipole scans only). 6C‐HexFEM in blue, 6C‐CutFEM in red, and 3C‐BEM in yellow. Outliers are depicted as circles, the horizontal bar inside the boxes state median values. The x‐axis is divided by the regularization schemes. Unregularized on the left and TSVD‐regularization on the right.
