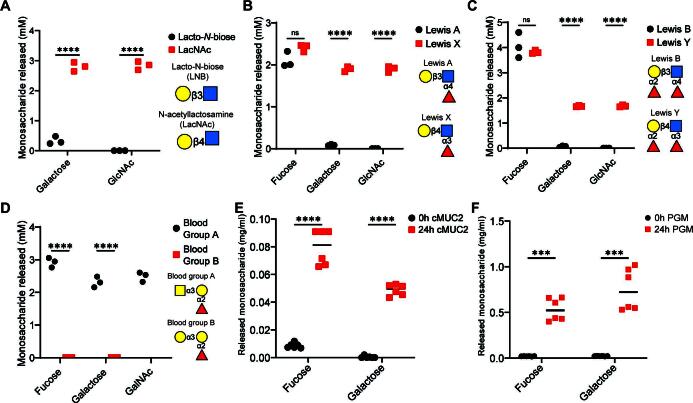
Fig 4.
R. torques supernatant enzymes exhibit linkage specificity on model mucin glycans and release monosaccharides from intact mucin glycoprotein substrates. (A–D) Quantification of monosaccharides released from lacto-N-biose (LNB) or N-acetyllactosamine (LacNAc) (5 mM concentration each, (A), Lewis a or Lewis x antigens (2 mM final concentration each, (B), Lewis b or Lewis y antigens (2 mM final concentration each, (C), and blood group A or blood group B (2 mM final concentration each, (D) by ammonium sulfate precipitated proteins from R. torques supernatants after growth on glucose, measured by high-performance anion exchange chromatography with pulsed amperometric detection. For LNB samples, the galactose concentration found in the negative control was subtracted from concentrations calculated for supernatant reactions due to the presence of a species with a similar retention time in the no-enzyme control reaction. For A–D, statistical analyses were performed with unpaired, two-tailed t-tests comparing release of each monosaccharide between substrates in each panel. ***P < 0.001, ****P < 0.0001. (E and F) Concentration of fucose or galactose released after 24-h incubation of R. torques supernatants with cMUC2 (2.5 mg/mL final; (E) or PGM (10 mg/mL final; (F). For E–F, statistics were analyzed with paired, two-tailed t-tests comparing release of each monosaccharide between substrates in each panel. ***P < 0.001, ****P < 0.0001. ns, not significant. For A–F, concentration values were calculated from a standard curve and values resulting in a negative concentration are displayed as 0 and were recorded as 0 for statistical analyses.

