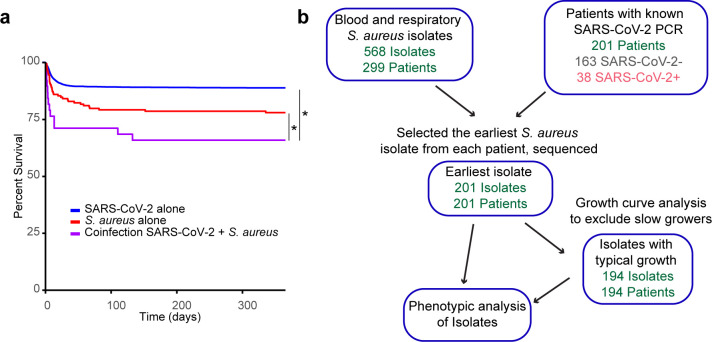
Fig 1.
Establishment of a biorepository of S. aureus during the early COVID-19 pandemic (a) Survival curve of patients in our cohort with SARS-CoV-2 confirmed by PCR, with S. aureus blood or respiratory culture or with both infections. Time = 0 on the day of positive S. aureus culture or in the case of SARS-CoV-2 alone, on the day of SARS-CoV-2 PCR positivity. Data were analyzed by Wilcoxon-Breslow test. (b) Generation of the cohort of patients and isolates analyzed in this study. *P < 0.05

