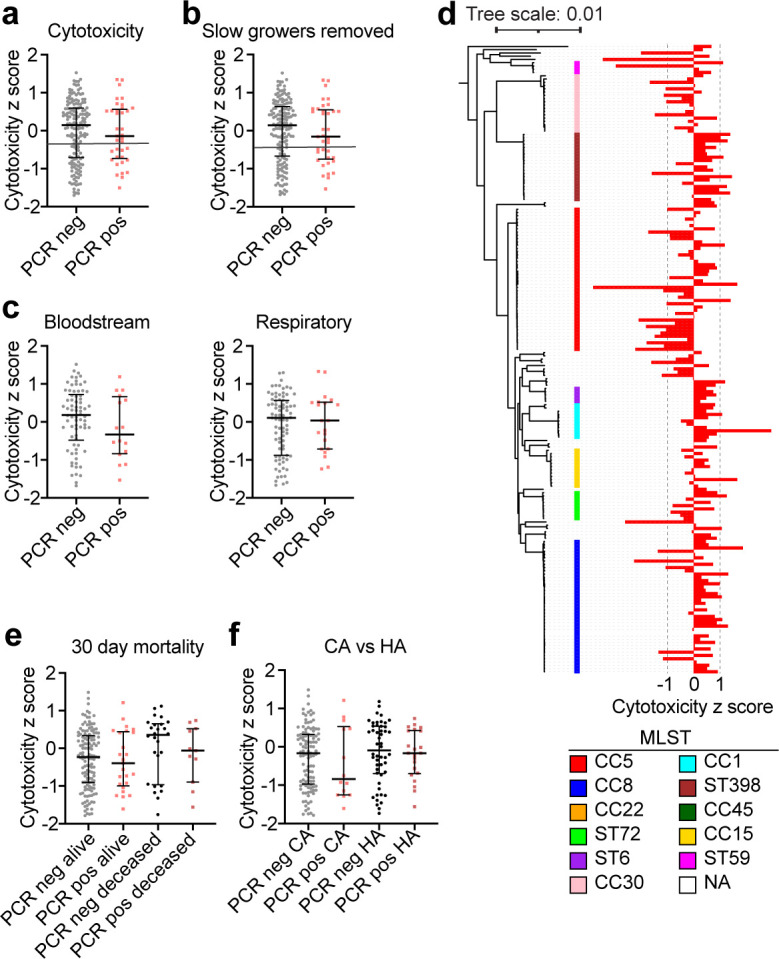
Fig 3.

Analysis of cytotoxicity of S. aureus isolates in vitro. (a) Cytotoxicity z-score for each isolate. Cytotoxicity was analyzed by infecting PMNs from human donors and quantifying cell lysis via LDH release. PCR pos are isolates from SARS-CoV-2+ patients, and PCR− are isolates from SARS-CoV-2- patients. (b) As in panel a, but without the isolates that grew slowly and were not able to reach an OD600 of 1 by the end of the overnight growth. The line in a and b indicates the cutoff used to define high and low cytotoxicity strains. (c) Cytotoxicity z-sores separated by the site of isolation. (d) Cytotoxicity visualized across the phylogenetic tree. (e) Cytotoxicity of isolates analyzed by 30-day mortality of the patients. (f) Cytotoxicity of isolates analyzed by community (CA) vs. healthcare (HA) acquisition. Error bars represent median with interquartile range. P > 0.05 for all plots, Mann-Whitney test (a-c), Kurksal-Wallis test (e and f).
