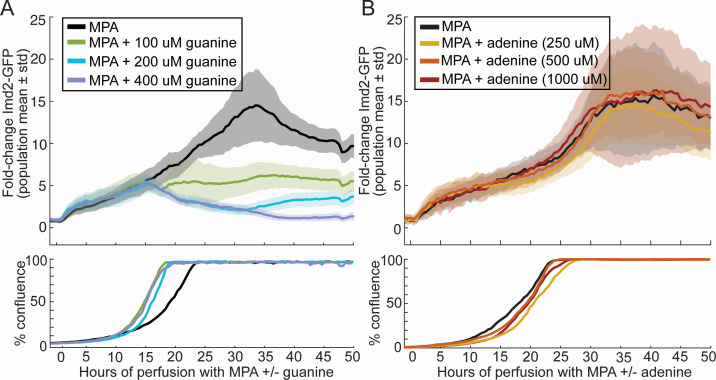
Fig 4.
Guanine-specific and dose-dependent suppression of Phase 2 induction of Imd2-GFP in the presence of MPA. (A) Top panel: population mean Imd2-GFP fold change (solid lines) with one standard deviation above and below the mean (shaded area) for 1.5 µg/mL MPA alone (black) or in the presence of 100 µM (green), 200 µM (blue), or 400 µM guanine (purple). Bottom panel: percentage of the viewing field occupied by cells over time. (B) Same as panel A, but with the indicated concentrations of adenine in place of guanine.

