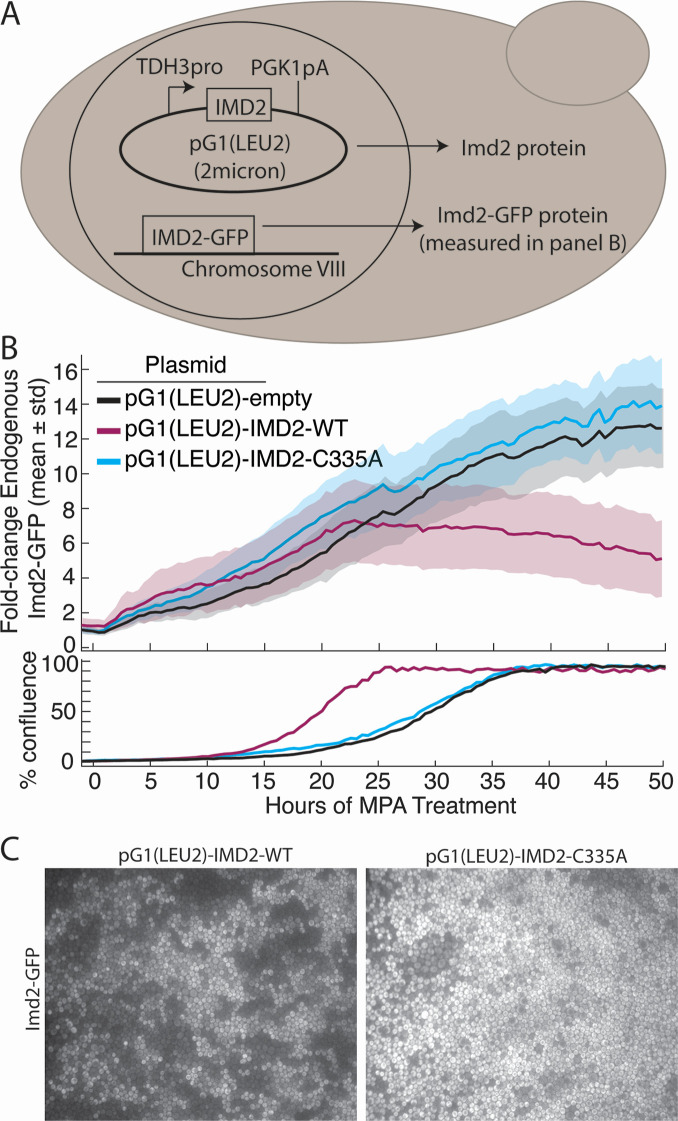
Fig 6.
Overexpression of catalytically active IMD2 from a plasmid decreases endogenous Imd2-GFP levels in confluent cells. (A) Schematic genotype of strains used in this experiment. TDH3pro: promoter region from the TDH3 gene; PGK1pA: 3′-UTR and polyA site from the PGK1 gene; 2 micron: high-copy yeast plasmid origin. (B) Top panel: levels of Imd2-GFP in cells treated with 1.5 µg/mL MPA and containing the pG1(LEU2) plasmid with no insert (black), IMD2-WT (purple), or the catalytically inactive IMD2-C335A allele (blue). Solid lines indicate population mean per cell GFP fluorescence and shading indicates one standard deviation above and below the mean. Bottom panel: the percentage of the viewing field occupied by cells over time. (C) Still images of the Imd2-GFP channel when cells expressing the pG1(LEU2)-IMD2-WT or pG1(LEU2)-IMD2-C335A plasmids first reached confluence.

