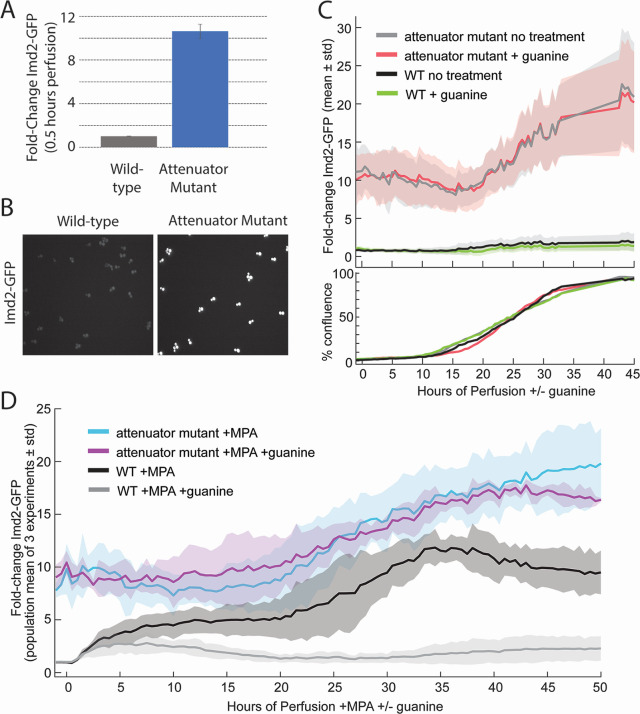
Fig 8.
Deletion of nonproductive “G” transcription start sites from IMD2 increases basal Imd2-GFP levels 10-fold and abolishes guanine sensitivity. (A) Imd2-GFP expression in the attenuator mutant strain (ELS107) compared with wild-type cells (KES002) after 0.5 hours of perfusion with untreated media based on seven experiments and at least two technical replicates per experiment. Imd2-GFP levels were normalized to the average Imd2-GFP expression of wild-type cells during the first hour of perfusion with untreated media. Error bars represent standard error of the mean. Based on a two-tailed t-test, P value = 4 × 10⁻¹². (B) Images showing the Imd2-GFP channel after 0.5 hours of perfusion with untreated media for wild-type KES002 cells (left) or attenuator mutant ELS107 cells (right). (C) Top panel: population mean Imd2-GFP fold induction (solid lines) with one standard deviation above and below the mean (shaded area) for attenuator mutant (ELS107) and wild-type (KES002) cells perfused with untreated media or 400 µM guanine (see key). Bottom panel: the percentage of the viewing field occupied by cells over time. (D) Population mean Imd2-GFP fold-induction averaged over three separate experiments (solid lines) with one standard deviation above and below the mean (shaded area) for attenuator mutant (ELS107) and wild-type (KES002) cells perfused with 1.5 µg/mL MPA or MPA with 400 µM guanine (see key).

