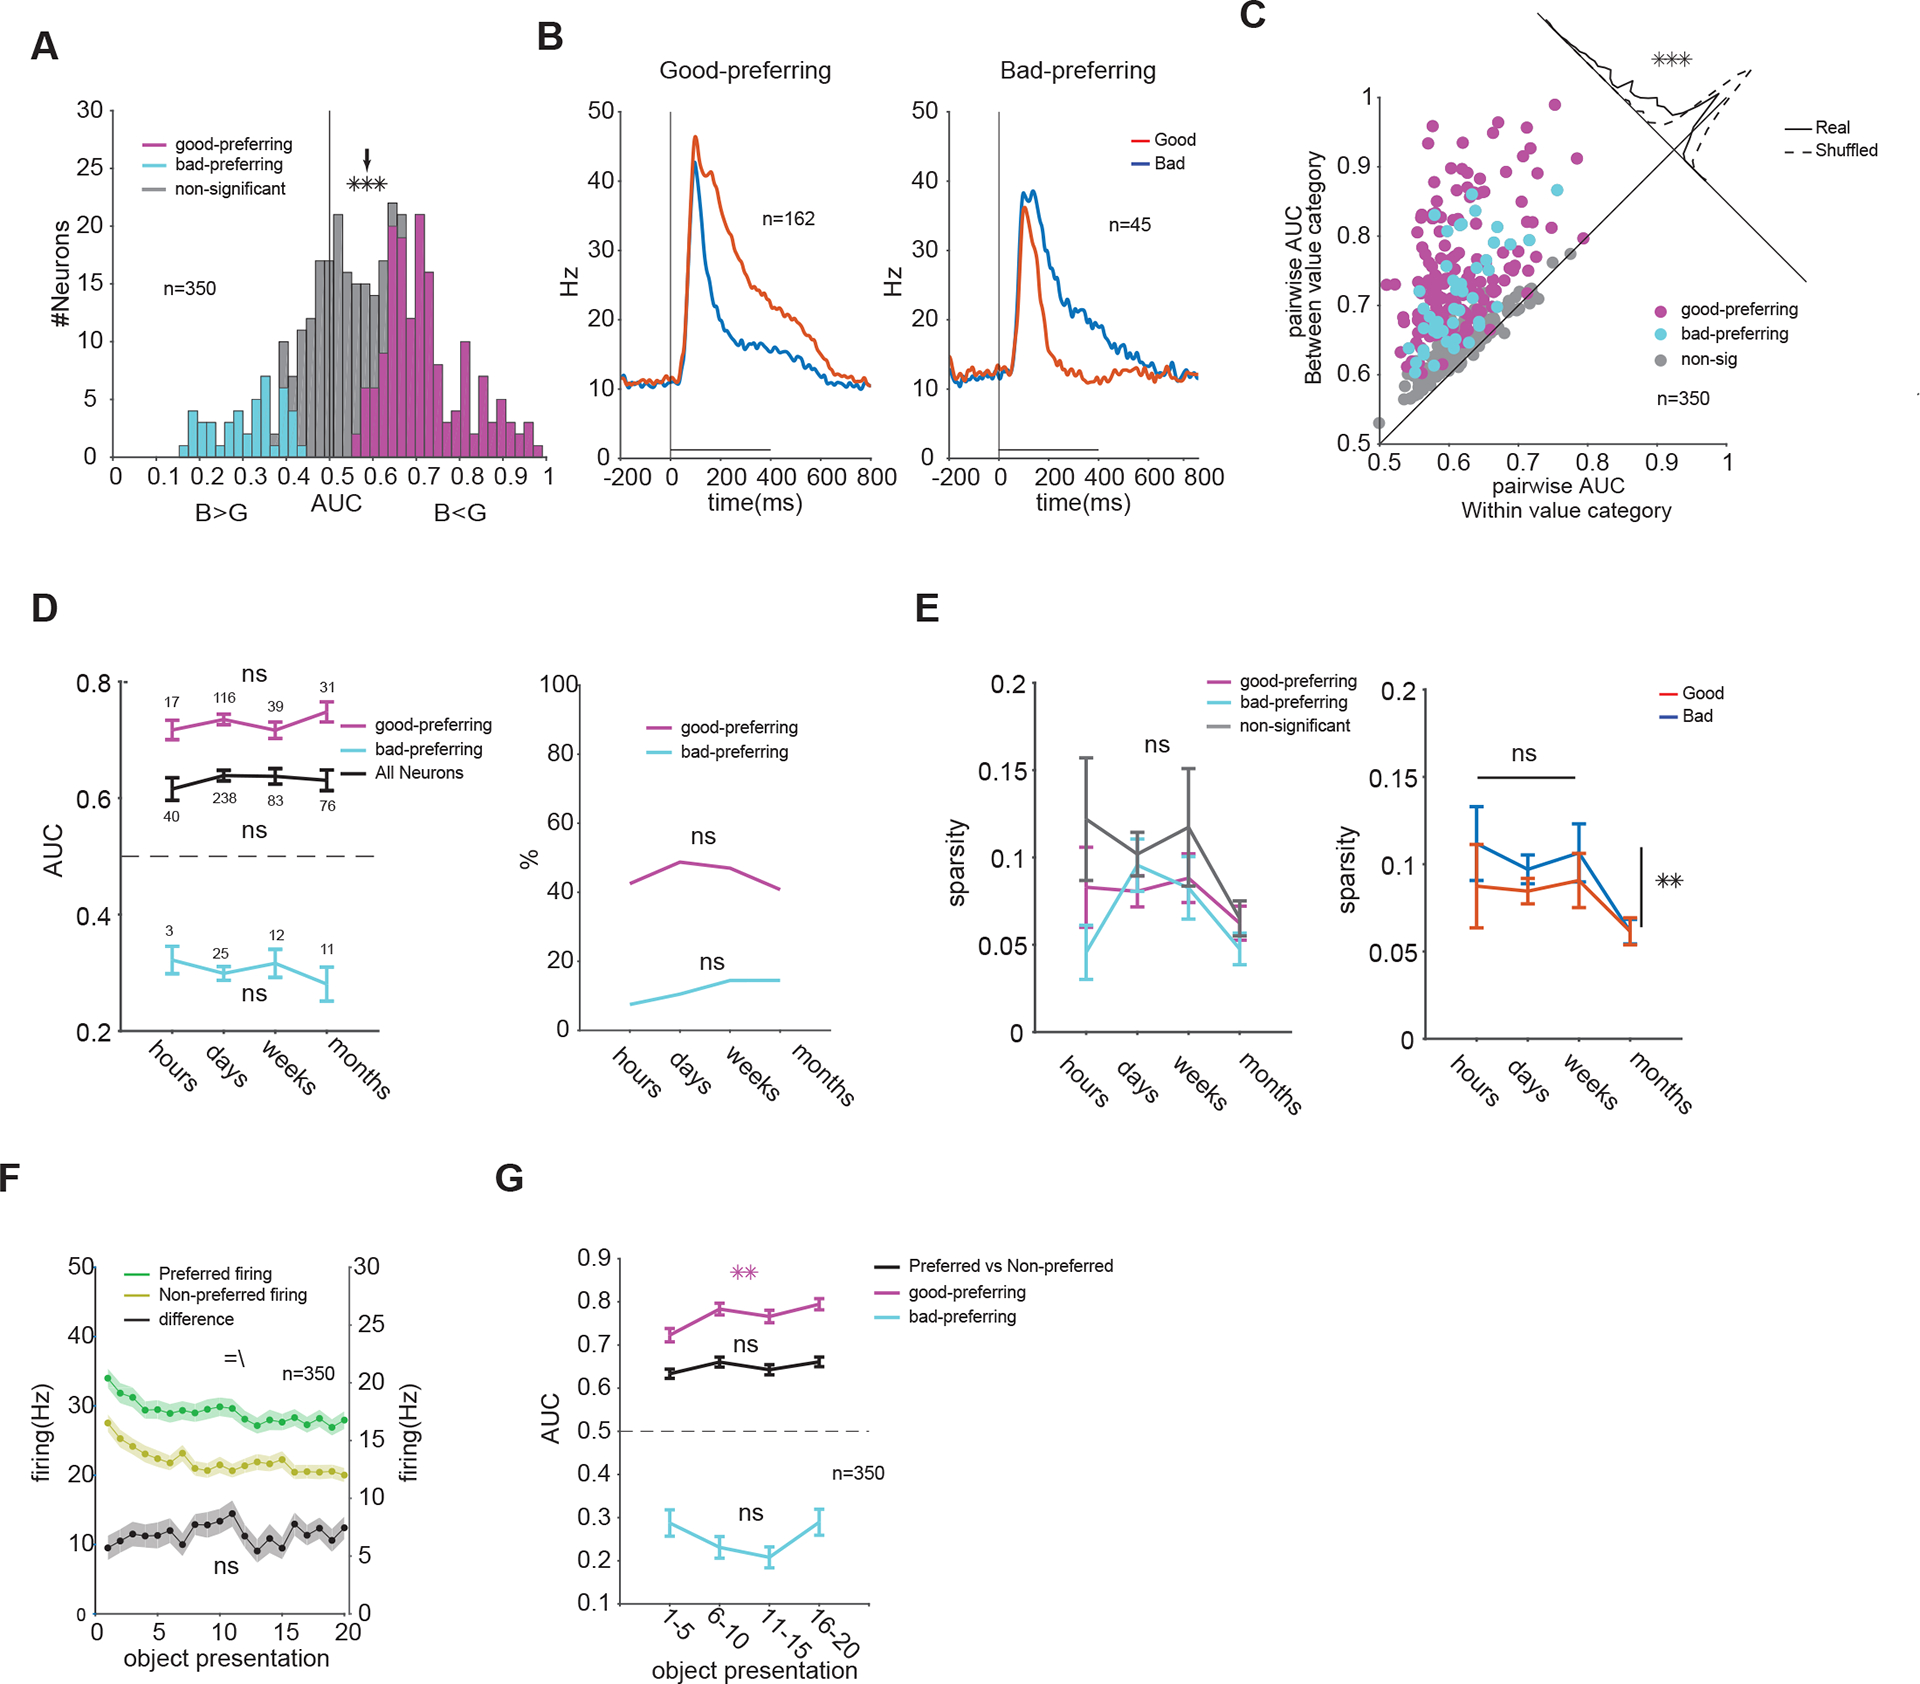
Figure 4. Value memory creates good vs bad object discriminability in PFC neurons which is resistant to passage of time and to extinction.

(A) Distribution of good vs bad object discrimination (AUC) across all neurons (arrow marks population average good vs bad AUC: 0.58, t349=9.8, P<10−19). (B) Average firing of good- and bad- preferring neurons (C) Average pairwise discriminability of objects between good and bad category (y-axis) compared to within good and bad category (x-axis) (correlation non-sig, P>0.8, see STAR Methods). Oblique distribution on top right shows deviation from the diagonal for the actual and shuffled data (t9=116, P<10−15). (D) Population average of preferred vs non-preferred value AUC (left, for all F3,433=0.7, P=0.5, for good-preferring F3,199=0.8, P=0.4 and for bad-preferring F3,47=0.5, P=0.6) and percentage of good- and bad-preferring neurons across 4 memory periods (right, , P>0.5). (E) Object selectivity as measured by sparsity in good- and bad-preferring neurons and in neurons non-significant for value (left, F3,424=1.6, P=0.16) and for good and bad objects across all neurons (F3,864=3.2, P=0.02, post hoc sparsity in month lower than other periods P<0.03 lsd). (F) Population average firing to preferred and non-preferred values (left axis) and their difference (right axis) as a function of repeated exposure to objects in the absence of reward during one passive viewing block. The presentations of a given object were not in consecutive trials and were usually intervened by other object presentations during passive viewing, but are plotted as consecutive trials for each object (main effects of value F1,13960=270, P<10−59[=] and of trials F19,13960=3.5, P<10−6[\], interaction P>0.9, main effect of trials on firing difference F19,6980=0.68, P>0.8). (G) Population average preferred vs non-preferred AUC as a function of repeated exposure to objects (F3,1396=1.46, P=0.2) and good vs bad AUCs averaged for good-(F3,644=4.9, P<0.01) and bad-preferring (F3,176=2.1, P=0.09) neurons. Data in A-C and F-G are collapsed over all memory periods. See also Figures S5 to S7
