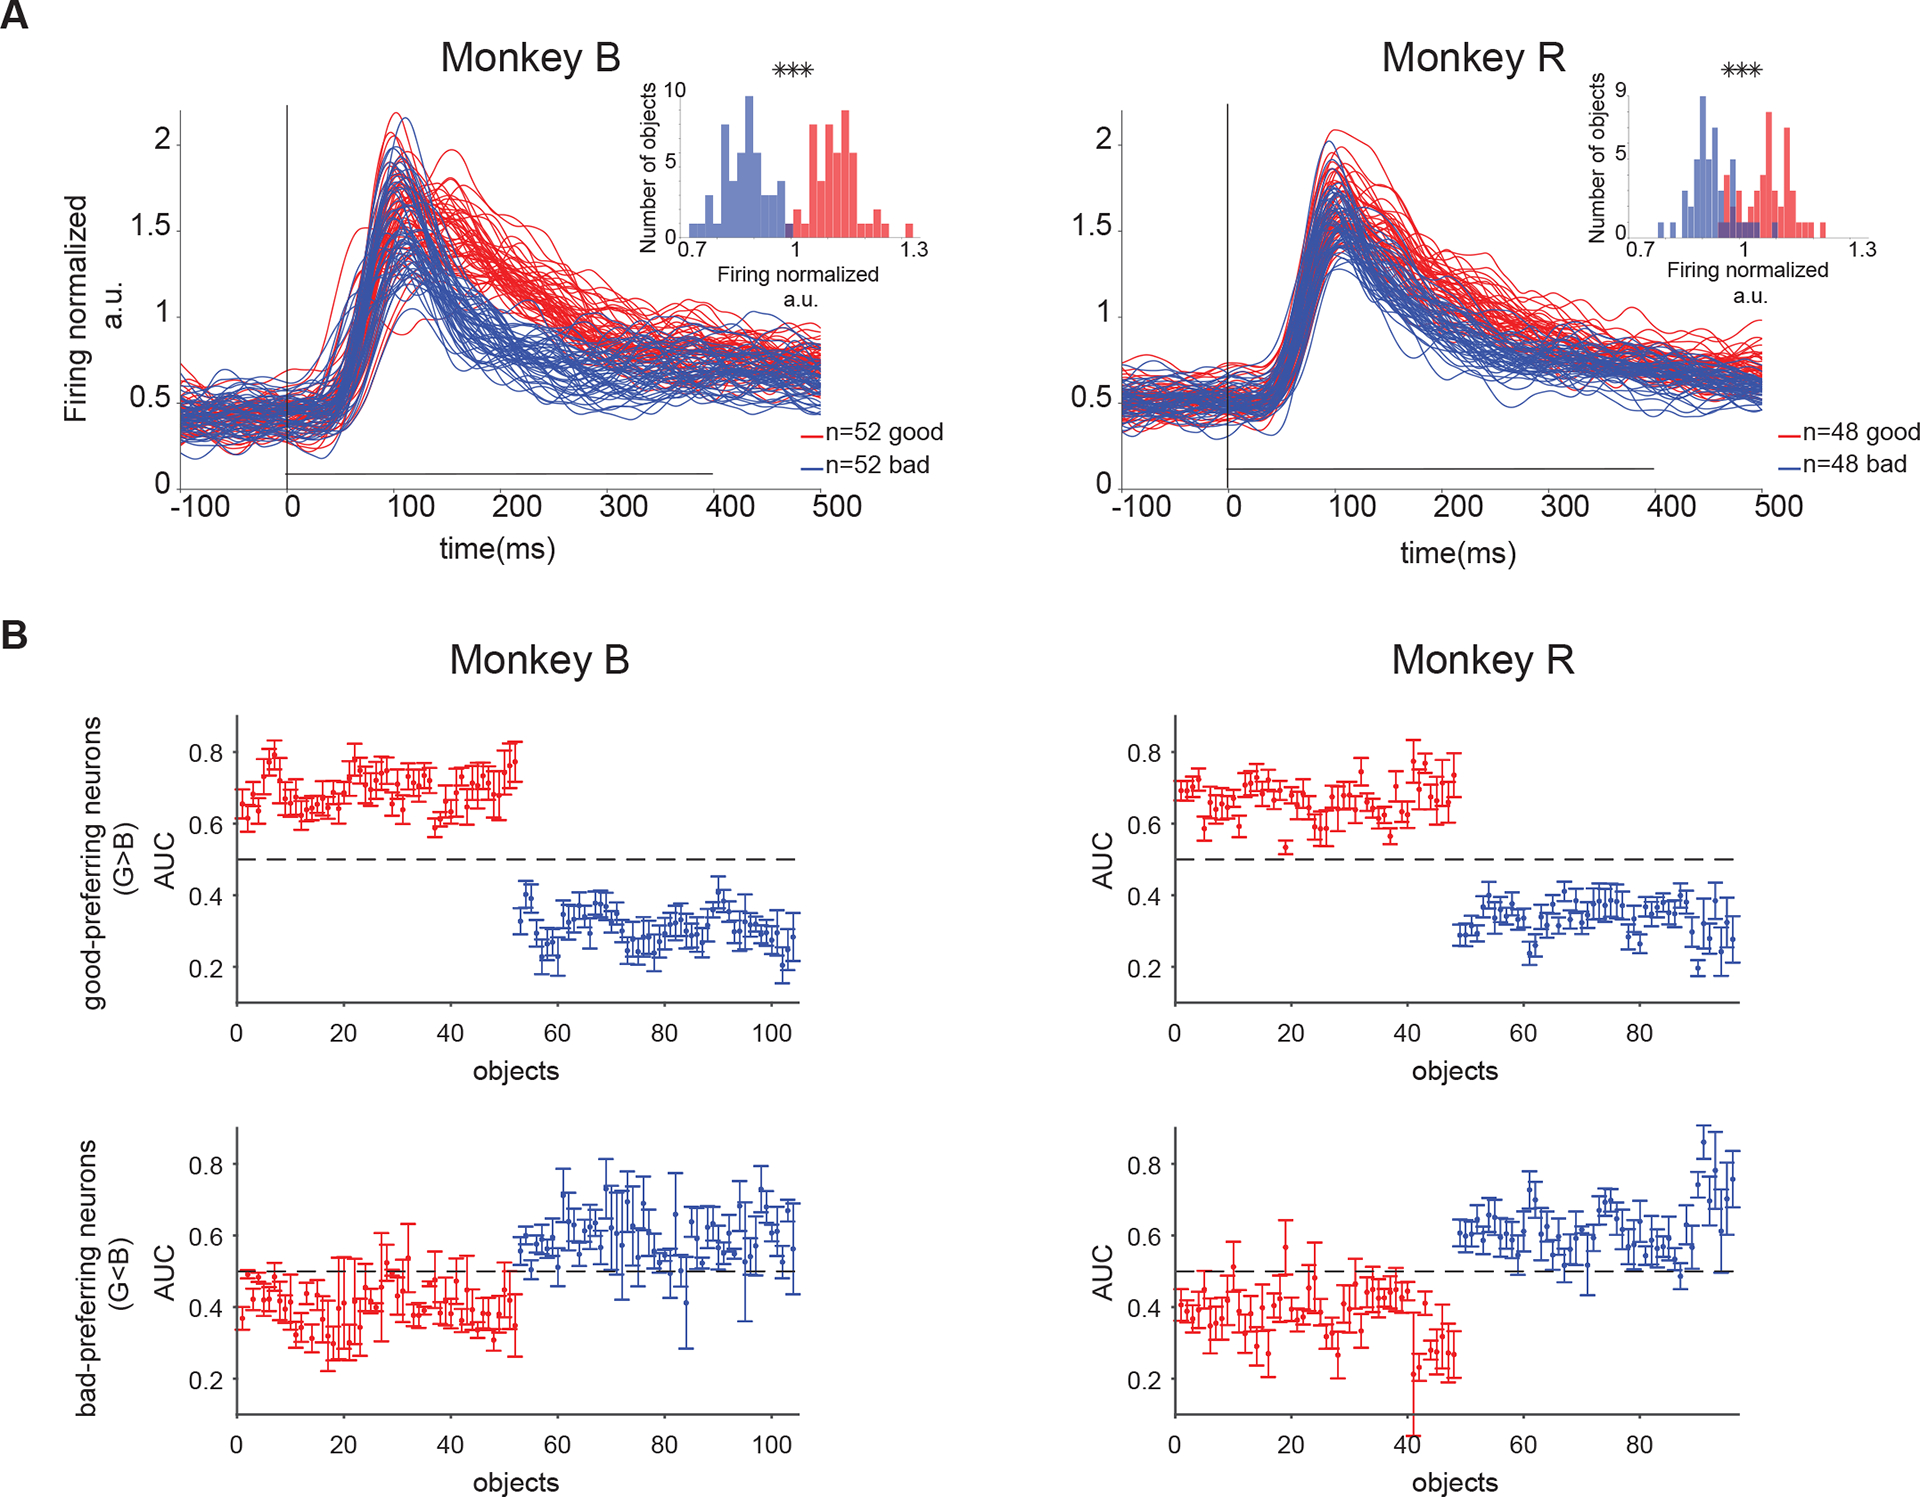
Figure 5. PFC value memory has high-capacity for objects.

(A) Average population response to all objects (good and bad) seen by monkey B (left) and R (right). The population response was normalized by mean firing in 100–400ms after object onset to all good and bad objects in a set shown in passive viewing. Small axes show histogram of response to all good and bad object (mean value in 100–400ms after object onset) for monkey B (left) and R (right). (B) Average AUC for each good object vs all other bad objects (red) and for each bad object vs all other good objects (blue) in a set across good-preferring (top row) and bad-preferring neurons (bottom row) in both monkeys.
