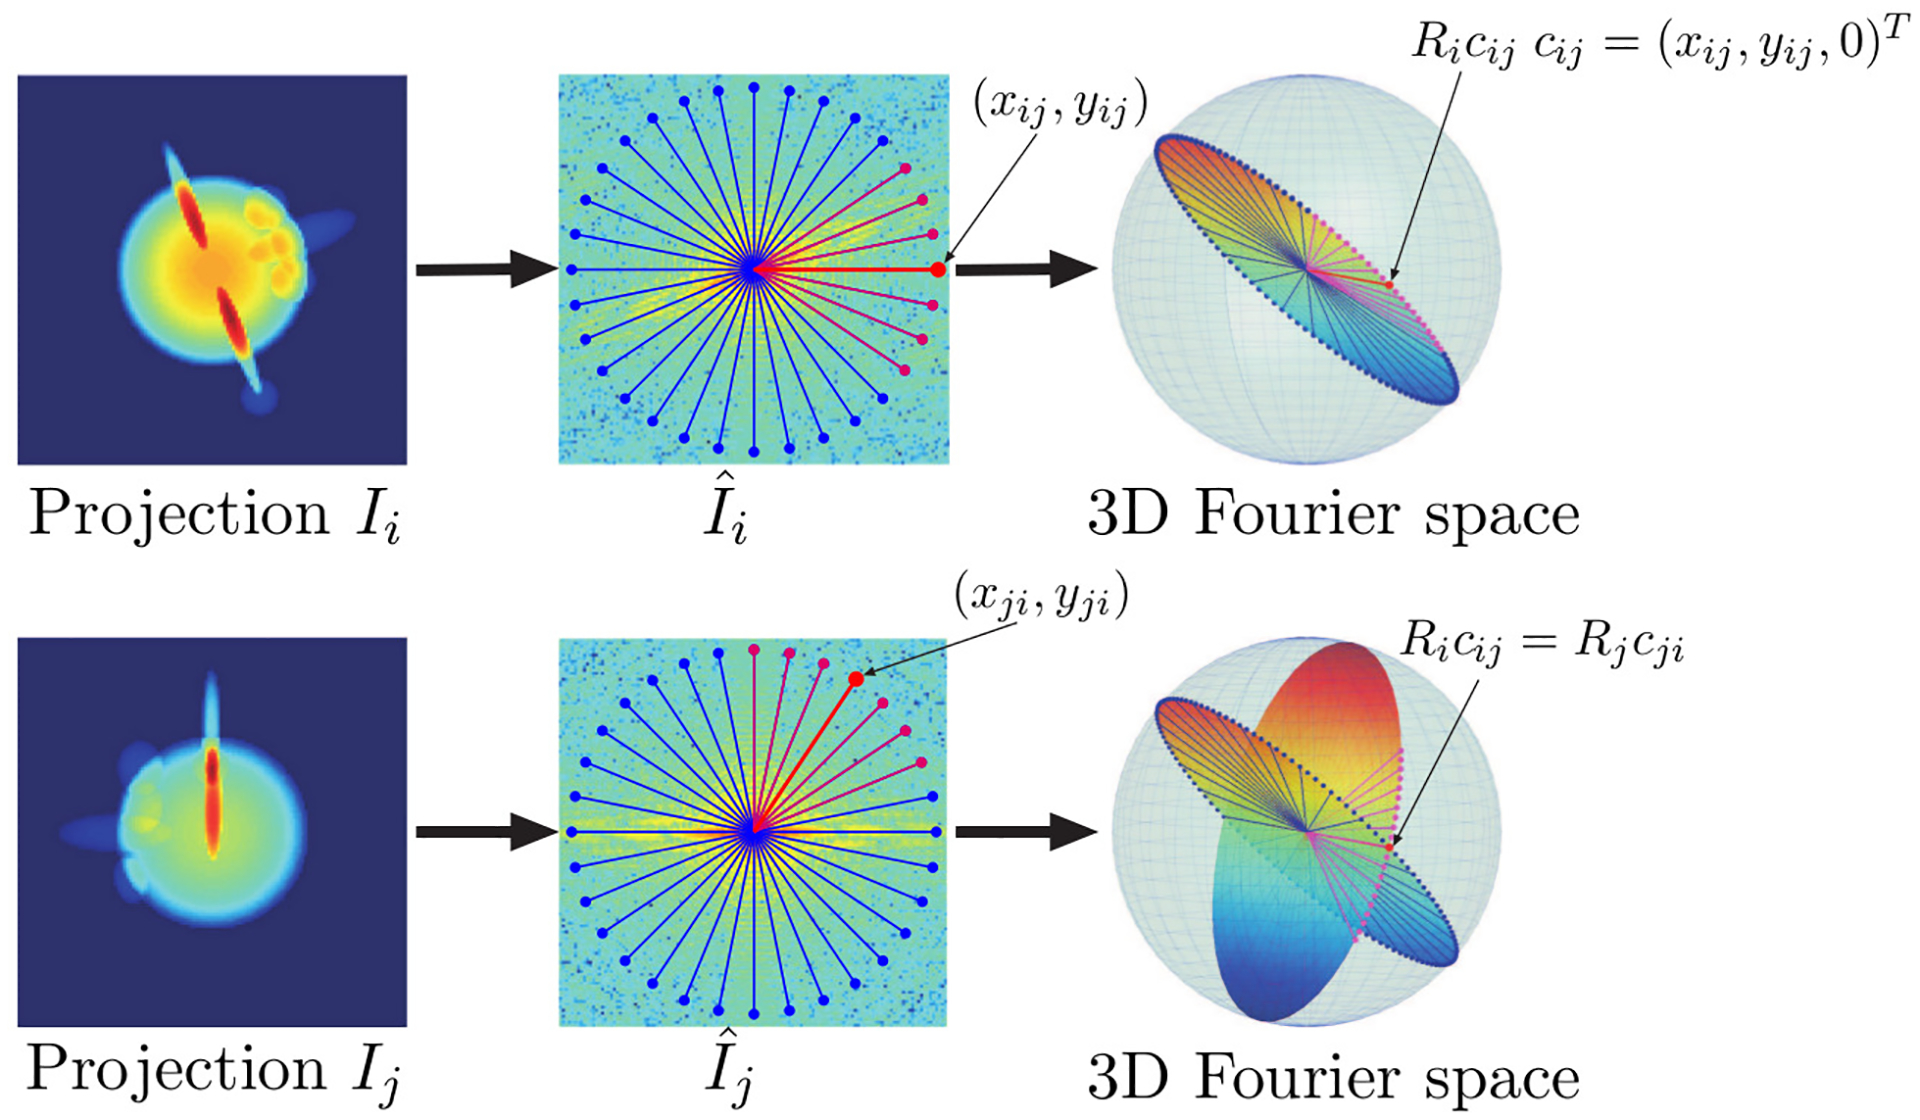
Figure 2:

Common Lines in cryo-EM. The left most images and are examples of projections of a molecule density ; each projection is obtained from a different direction. At the center, are the Fourier transforms and of those images, overlaid with radial lines. The lower right sub-figure is a visualization of the two slices of the 3-D Fourier transform of the 3-D density , corresponding to and ; the two slices intersect each other, so that there is a line in that is identical to a line in (assuming no noise). Indeed, the point which lies along this common line in is identical to the point which lies along this common line in . A more detailed discussion of common lines is available, for example, in [8, 9, 10, 11]
