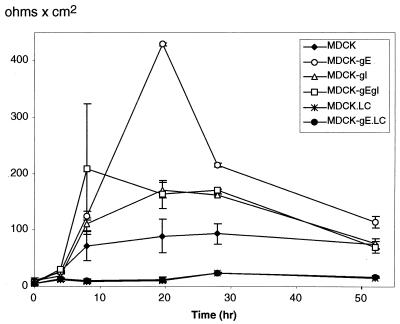
FIG. 5.
Development of TER in MDCK cells constitutively expressing VZV gE, gI, or gE/gI. The kinetics of TER was measured sequentially over 54 h in clones of VZV gE-, gI-, or gE/gI-expressing MDCK cells, tested from the time of calcium switch, at time zero to NC conditions. The y axis indicates TER, and the x axis indicates the time (hour) at which TER was measured. TER measurements are given for MDCK, MDCK-gE, MDCK-gI, and MDCK-gE/gI cell lines in NC medium; measurements were also made with MDCK (MDCK.LC) and MDCK-gE (MDCK-gE.LC) cell lines in LC medium. The data are reported as the means ± standard deviations for three assays. At the end of each experiment, filters were fixed and stained with Hoechst 33342 to confirm the integrity of the monolayer.

